J
Landlord's Agent in 2024
Joanna Hochman
Gibson Sothebys International Realty
2 in this area
31 Total Sales
Estimated Value: $455,000 - $528,000
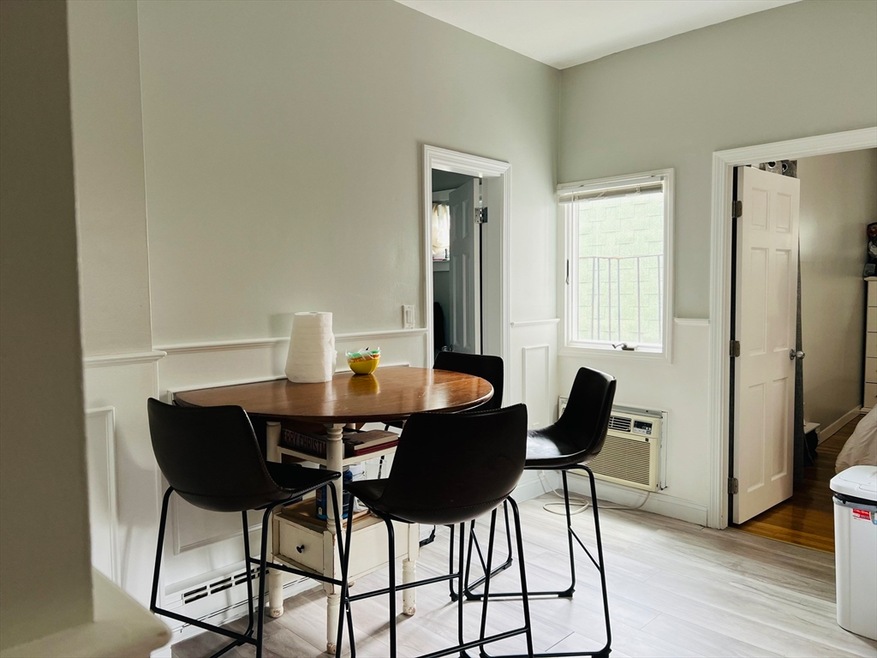
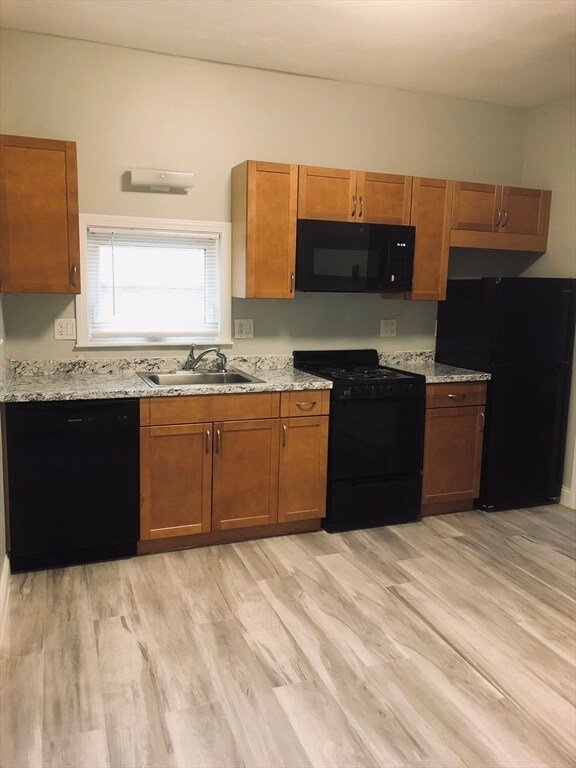
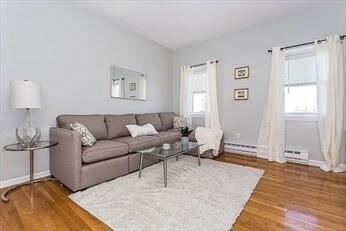
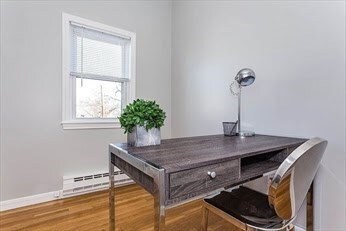
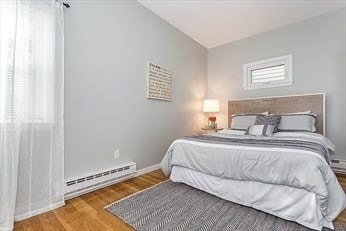
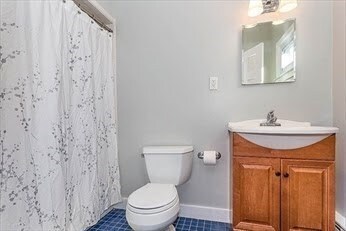
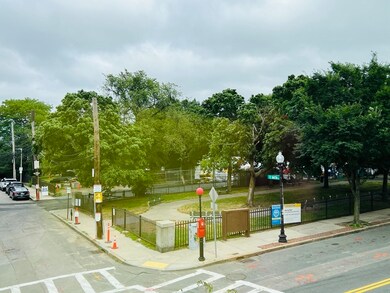
Renovated in 2021, this airy one-bedroom plus spacious office with built-in armoire has hardwood floors and plenty of windows with 3 exposures. Enjoy beautiful park views and a glimpse of the bay from your front-facing living room and home office! This 2nd floor unit is in a well-maintained 4-unit condo building conveniently located close to public transportation, highway access, the Encore complex, great shopping and restaurants as well as the wonderful community amenities of Charlestown!
Last Agent to Rent the Property
Gibson Sotheby's International Realty Listed on: 07/08/2024

| Date | Buyer | Sale Price | Title Company |
|---|---|---|---|
| Etude 2 Llc | $407,000 | None Available | |
| Heye Jocelyn | $194,000 | -- |
| Date | Event | Price | List to Sale | Price per Sq Ft | Prior Sale |
|---|---|---|---|---|---|
| 11/29/2024 11/29/24 | Off Market | $2,600 | -- | -- | |
| 09/26/2024 09/26/24 | For Rent | $2,600 | +10.9% | -- | |
| 09/10/2024 09/10/24 | Rented | $2,345 | -6.0% | -- | |
| 09/04/2024 09/04/24 | For Rent | $2,495 | 0.0% | -- | |
| 08/31/2024 08/31/24 | Off Market | $2,495 | -- | -- | |
| 08/14/2024 08/14/24 | Price Changed | $2,495 | -4.0% | $4 / Sq Ft | |
| 07/08/2024 07/08/24 | For Rent | $2,600 | +14.3% | -- | |
| 08/20/2021 08/20/21 | Rented | $2,275 | -5.2% | -- | |
| 08/16/2021 08/16/21 | Under Contract | -- | -- | -- | |
| 07/20/2021 07/20/21 | Price Changed | $2,400 | -5.9% | $4 / Sq Ft | |
| 07/14/2021 07/14/21 | For Rent | $2,550 | +12.1% | -- | |
| 05/13/2021 05/13/21 | Off Market | $2,275 | -- | -- | |
| 03/18/2021 03/18/21 | Sold | $407,000 | 0.0% | $698 / Sq Ft | View Prior Sale |
| 03/05/2021 03/05/21 | For Rent | $2,275 | 0.0% | -- | |
| 01/21/2021 01/21/21 | Pending | -- | -- | -- | |
| 01/11/2021 01/11/21 | For Sale | $389,000 | 0.0% | $667 / Sq Ft | |
| 10/24/2018 10/24/18 | Rented | $1,700 | 0.0% | -- | |
| 10/18/2018 10/18/18 | Under Contract | -- | -- | -- | |
| 10/10/2018 10/10/18 | For Rent | $1,700 | -5.6% | -- | |
| 06/30/2017 06/30/17 | Rented | $1,800 | 0.0% | -- | |
| 06/14/2017 06/14/17 | Under Contract | -- | -- | -- | |
| 05/25/2017 05/25/17 | For Rent | $1,800 | +5.9% | -- | |
| 08/10/2015 08/10/15 | Rented | $1,700 | +30.8% | -- | |
| 08/10/2015 08/10/15 | For Rent | $1,300 | -- | -- |
| Year | Tax Paid | Tax Assessment Tax Assessment Total Assessment is a certain percentage of the fair market value that is determined by local assessors to be the total taxable value of land and additions on the property. | Land | Improvement |
|---|---|---|---|---|
| 2025 | $4,535 | $391,600 | $0 | $391,600 |
| 2024 | $4,437 | $407,100 | $0 | $407,100 |
| 2023 | $4,242 | $395,000 | $0 | $395,000 |
| 2022 | $4,132 | $379,800 | $0 | $379,800 |
| 2021 | $4,405 | $412,800 | $0 | $412,800 |
| 2020 | $3,802 | $360,000 | $0 | $360,000 |
| 2019 | $3,388 | $321,400 | $0 | $321,400 |
| 2018 | $3,207 | $306,000 | $0 | $306,000 |
| 2017 | $3,117 | $294,300 | $0 | $294,300 |
| 2016 | $3,143 | $285,700 | $0 | $285,700 |
| 2015 | $2,602 | $214,830 | $0 | $214,830 |
| 2014 | $2,478 | $197,010 | $0 | $197,010 |
J
Landlord's Agent in 2024
Joanna Hochman
Gibson Sothebys International Realty
2 in this area
31 Total Sales
Seller's Agent in 2021
Lesley Smith
Barrett Sotheby's International Realty
(781) 405-2991
4 in this area
59 Total Sales
N
Buyer's Agent in 2018
Non Member
Non Member Office
Source: MLS Property Information Network (MLS PIN)
MLS Number: 73260884
APN: CHAR-000000-000002-001187-000006
Disclaimer: Certain information contained herein is derived from information provided by parties other than Homes.com. All information provided is deemed reliable, but is not guaranteed to be accurate and should be independently verified.
![]() The property listing data and information, or the Images, set forth herein were provided to MLS Property Information Network, Inc. from third party sources, including sellers, lessors and public records, and were compiled by MLS Property Information Network, Inc. The property listing data and information, and the Images, are for the personal, non-commercial use of consumers having a good faith interest in purchasing or leasing listed properties of the type displayed to them and may not be used for any purpose other than to identify prospective properties which such consumers may have a good faith interest in purchasing or leasing. MLS Property Information Network, Inc. and its subscribers disclaim any and all representations and warranties as to the accuracy of the property listing data and information, or as to the accuracy of any of the Images, set forth herein.
The property listing data and information, or the Images, set forth herein were provided to MLS Property Information Network, Inc. from third party sources, including sellers, lessors and public records, and were compiled by MLS Property Information Network, Inc. The property listing data and information, and the Images, are for the personal, non-commercial use of consumers having a good faith interest in purchasing or leasing listed properties of the type displayed to them and may not be used for any purpose other than to identify prospective properties which such consumers may have a good faith interest in purchasing or leasing. MLS Property Information Network, Inc. and its subscribers disclaim any and all representations and warranties as to the accuracy of the property listing data and information, or as to the accuracy of any of the Images, set forth herein.