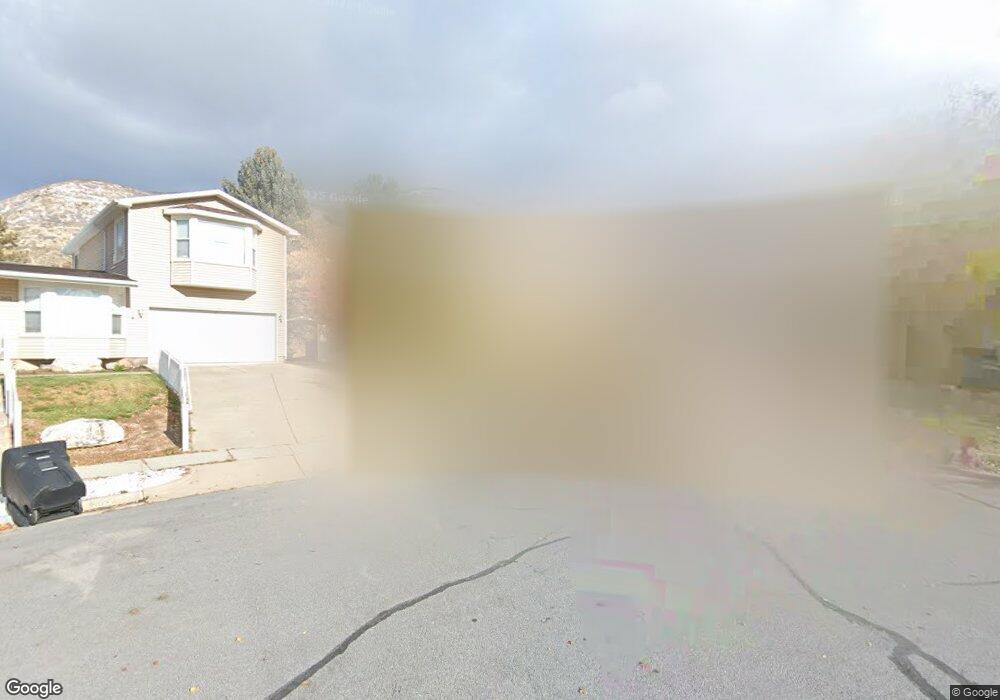
372 E 700 N Centerville, UT 84014
Estimated Value: $502,000 - $599,000
3
Beds
3
Baths
1,414
Sq Ft
$390/Sq Ft
Est. Value
About This Home
This home is located at 372 E 700 N, Centerville, UT 84014 and is currently estimated at $551,191, approximately $389 per square foot. 372 E 700 N is a home located in Davis County with nearby schools including Centerville Elementary, Centerville Jr High, and Viewmont High School.
Ownership History
Date
Name
Owned For
Owner Type
Purchase Details
Closed on
Nov 28, 2012
Sold by
Rolfsen Juliana
Bought by
Larsen Leland A and Larsen Arlynne K
Current Estimated Value
Home Financials for this Owner
Home Financials are based on the most recent Mortgage that was taken out on this home.
Original Mortgage
$216,015
Outstanding Balance
$148,278
Interest Rate
3.25%
Mortgage Type
FHA
Estimated Equity
$402,913
Purchase Details
Closed on
Sep 28, 2012
Sold by
Beck Juliana M
Bought by
Rolfsen Juliana and The Rolfsen Family Trust
Purchase Details
Closed on
Feb 20, 2002
Sold by
Isaacson Donna Johnson
Bought by
Beck Julian M
Home Financials for this Owner
Home Financials are based on the most recent Mortgage that was taken out on this home.
Original Mortgage
$185,640
Interest Rate
7.04%
Mortgage Type
VA
Purchase Details
Closed on
Jul 29, 1998
Sold by
Isaacson E Arnold and Isaacson Donna J
Bought by
Isaacson Donna Johnson and Donna Johnson Isaacson Trust
Create a Home Valuation Report for This Property
The Home Valuation Report is an in-depth analysis detailing your home's value as well as a comparison with similar homes in the area
Purchase History
| Date | Buyer | Sale Price | Title Company |
|---|---|---|---|
| Larsen Leland A | -- | Monument Title Ins | |
| Rolfsen Juliana | -- | None Available | |
| Beck Julian M | -- | Associated Title Company | |
| Isaacson Donna Johnson | -- | -- |
Source: Public Records
Mortgage History
| Date | Status | Borrower | Loan Amount |
|---|---|---|---|
| Open | Larsen Leland A | $216,015 | |
| Previous Owner | Beck Julian M | $185,640 |
Source: Public Records
Tax History
| Year | Tax Paid | Tax Assessment Tax Assessment Total Assessment is a certain percentage of the fair market value that is determined by local assessors to be the total taxable value of land and additions on the property. | Land | Improvement |
|---|---|---|---|---|
| 2025 | $3,116 | $298,100 | $170,178 | $127,922 |
| 2024 | $3,121 | $303,600 | $152,641 | $150,959 |
| 2023 | $2,884 | $507,000 | $250,798 | $256,202 |
| 2022 | $3,051 | $295,350 | $126,554 | $168,796 |
| 2021 | $2,666 | $402,000 | $192,620 | $209,380 |
| 2020 | $2,308 | $348,000 | $188,435 | $159,565 |
| 2019 | $2,330 | $343,000 | $189,907 | $153,093 |
| 2018 | $2,165 | $315,000 | $176,273 | $138,727 |
| 2016 | $1,850 | $149,545 | $58,524 | $91,021 |
| 2015 | $1,823 | $139,040 | $58,524 | $80,516 |
| 2014 | $1,746 | $136,271 | $58,524 | $77,747 |
| 2013 | -- | $128,174 | $48,624 | $79,550 |
Source: Public Records
Map
Nearby Homes
- 243 Balsam Dr
- 563 N 220 E
- 984 N 500 E
- 380 E 400 N
- 1092 N 500 E
- 66 Brookside Ln
- 252 N 400 E
- 775 Pheasantbrook Cir
- 165 W Pheasantbrook Dr
- 282 W 605 N Unit A
- 282 W 605 N Unit I
- 281 W 650 N Unit B
- 56 W 200 N
- 1290 Oakridge Dr
- 303 W 650 N Unit I
- 185 N 50 W
- 781 Pheasantbrook Dr
- 360 E Center St
- 16 S 200 E
- 132 W 200 N
Your Personal Tour Guide
Ask me questions while you tour the home.