Estimated Value: $406,481 - $437,000
3
Beds
2
Baths
1,480
Sq Ft
$284/Sq Ft
Est. Value
About This Home
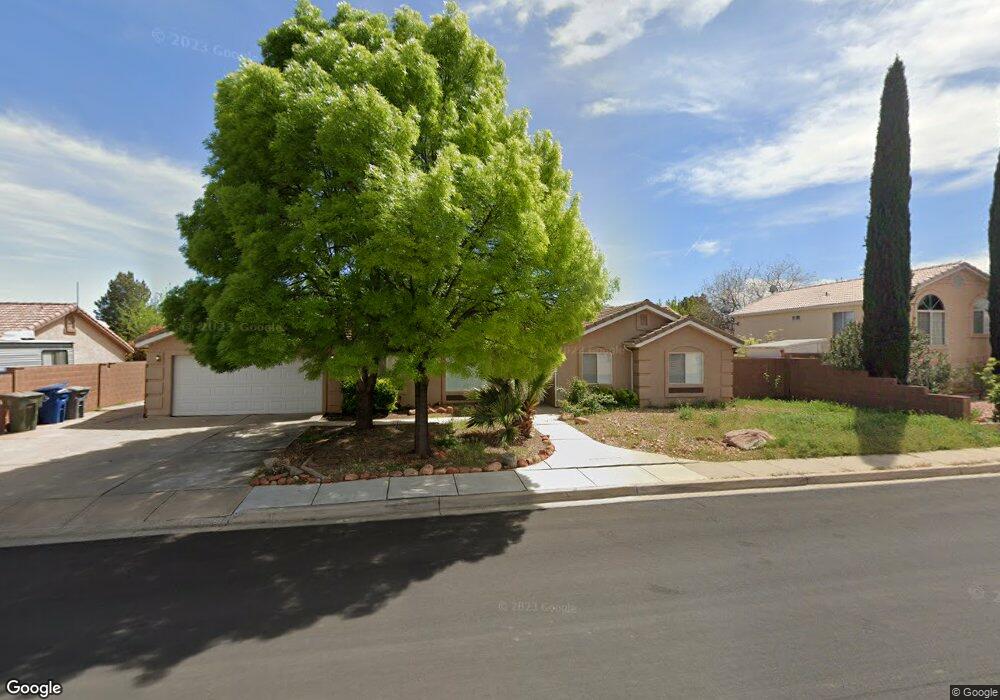
This home is located at 372 E 800 S, Ivins, UT 84738 and is currently estimated at $419,620, approximately $283 per square foot. 372 E 800 S is a home located in Washington County with nearby schools including Red Mountain School, Snow Canyon Middle School, and Lava Ridge Intermediate School.
Ownership History
Date
Name
Owned For
Owner Type
Purchase Details
Closed on
Feb 26, 2020
Sold by
Mills Mark A and Mills Jeanette D
Bought by
Donohoo Jon P
Current Estimated Value
Purchase Details
Closed on
Mar 4, 2014
Sold by
Friede Gary and Friede Susan
Bought by
Mills Mark A and Mills Jeanette D
Home Financials for this Owner
Home Financials are based on the most recent Mortgage that was taken out on this home.
Original Mortgage
$130,500
Interest Rate
4.34%
Mortgage Type
New Conventional
Purchase Details
Closed on
Feb 20, 2013
Sold by
Friede Gary W and Friede Susan K
Bought by
Friede Gary and Friede Susan K
Purchase Details
Closed on
Mar 11, 2009
Sold by
Handley Kathleen Hall and The Hall Family Trust
Bought by
Friede Gary W and Friede Susan K
Home Financials for this Owner
Home Financials are based on the most recent Mortgage that was taken out on this home.
Original Mortgage
$118,000
Interest Rate
5.15%
Mortgage Type
Purchase Money Mortgage
Create a Home Valuation Report for This Property
The Home Valuation Report is an in-depth analysis detailing your home's value as well as a comparison with similar homes in the area
Purchase History
| Date | Buyer | Sale Price | Title Company |
|---|---|---|---|
| Donohoo Jon P | -- | None Available | |
| Mills Mark A | -- | Integrated Title Ins Svcs Ll | |
| Friede Gary | -- | None Available | |
| Friede Gary W | -- | Southern Utah Title |
Source: Public Records
Mortgage History
| Date | Status | Borrower | Loan Amount |
|---|---|---|---|
| Previous Owner | Mills Mark A | $130,500 | |
| Previous Owner | Friede Gary W | $118,000 |
Source: Public Records
Tax History
| Year | Tax Paid | Tax Assessment Tax Assessment Total Assessment is a certain percentage of the fair market value that is determined by local assessors to be the total taxable value of land and additions on the property. | Land | Improvement |
|---|---|---|---|---|
| 2025 | $1,492 | $221,705 | $68,750 | $152,955 |
| 2023 | $1,546 | $226,490 | $57,750 | $168,740 |
| 2022 | $1,566 | $216,040 | $52,250 | $163,790 |
| 2021 | $1,450 | $297,100 | $65,000 | $232,100 |
| 2020 | $1,269 | $246,200 | $60,000 | $186,200 |
| 2019 | $1,268 | $240,500 | $45,000 | $195,500 |
| 2018 | $1,126 | $106,865 | $0 | $0 |
| 2017 | $1,050 | $99,715 | $0 | $0 |
| 2016 | $1,111 | $97,460 | $0 | $0 |
| 2015 | $1,107 | $93,445 | $0 | $0 |
| 2014 | $1,002 | $154,500 | $0 | $0 |
Source: Public Records
Map
Nearby Homes
- 362 E 680 S Unit 52
- 223 E 800 S
- 2600 Ocotillo Way Unit 56
- 2600 Ocotillo Way Unit 34 & 35
- 2600 Ocotillo Way Unit 34
- 2600 Ocotillo Way Unit 47
- 2600 Ocotillo Way Unit 20
- 668 S 315 E Unit 45
- 334 E 615 S Unit 17
- 375 E 615 S
- 336 E Desert Rose Way
- 3780 W Arcadia Dr Unit 39
- 3780 W Arcadia Dr Unit 66
- 3780 W Arcadia Dr Unit 29
- 3780 W Arcadia Dr Unit 27
- 3780 W Arcadia Dr Unit 45
- 3780 W Arcadia Dr Unit 49
- 4263 Bella Vista Dr
- 312 E Desert Rose Way
- 567 S Fiesta Dr
Your Personal Tour Guide
Ask me questions while you tour the home.