NOT LISTED FOR SALE

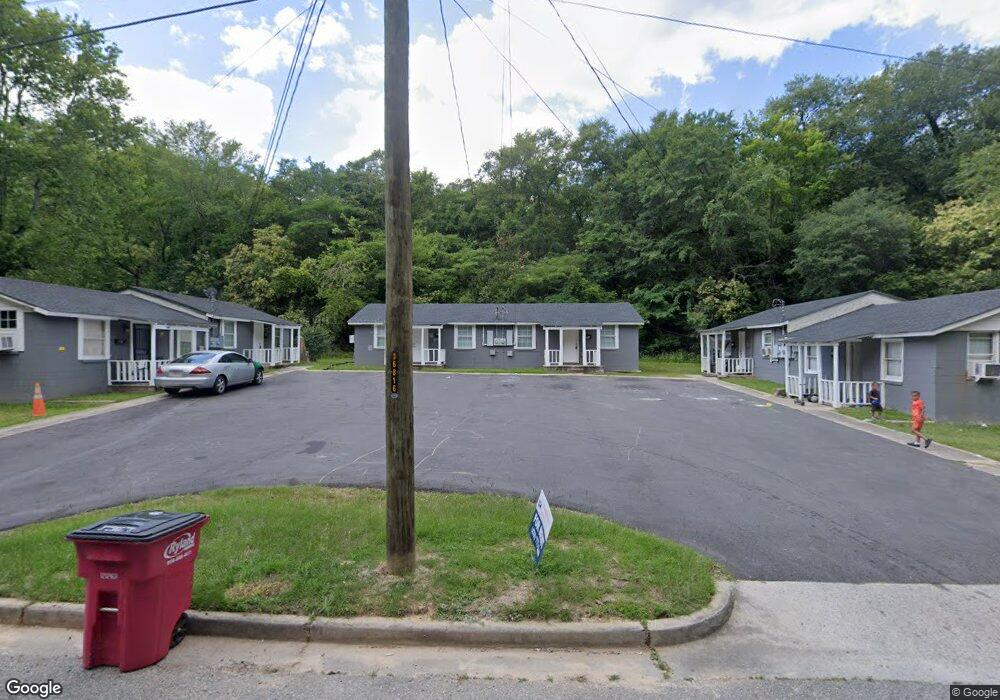
372 Grier St Unit 372 - 382 GRIER ST. Macon, GA 31204

Pleasant Hill Historic District Neighborhood

Estimated Value: $86,000 - $255,000

4 Beds
2 Baths
1,248 Sq Ft
$145/Sq Ft Est. Value

About This Home

This home is located at 372 Grier St Unit 372 - 382 GRIER ST., Macon, GA 31204 and is currently estimated at $180,628, approximately $144 per square foot. 372 Grier St Unit 372 - 382 GRIER ST. is a home located in Bibb County with nearby schools including Williams Elementary School, Miller Fine Arts Magnet Middle School, and Central High School.

Ownership History

Date Name Owned For Owner Type

Purchase Details

Closed on
Dec 13, 2024
Sold by
Atlanta Discount Home Deals Llc
Bought by
Dr Hoo Trust and Humphery
Current Estimated Value
$180,628

Purchase Details

Closed on
Nov 12, 2020
Sold by
Powerful Intentions Llc
Bought by
Sga Multifamily Tel Llc and Sga Multifamily Ael Llc

Purchase Details

Closed on
Sep 13, 2019
Sold by
Machkaez Real Estate Investors Llc
Bought by
Powerful Intentions Llc

Purchase Details

Closed on
Jun 6, 2018
Sold by
Hopkins Harry
Bought by
Machkaez Real Estate Investors Llc

Purchase Details

Closed on
Nov 12, 2010
Sold by
Powerful Intentions Llc
Bought by
Sga Multifamily Tel Llc and Sga Multifamily Ael Llc

Purchase Details

Closed on
Oct 20, 2003
Bought by
Hopkins Harry

Range of Values:

Collateral Analytics

Collateral Analytics Collateral Analytics AVMs (Automated Valuation Model) employ a number of statistical approaches combined with neighborhood-specific comparable selection guarantees the most up-to-date and precise valuations.

Not Available

Collateral Analytics does not have data for the current month. Please view the chart for historical values.

ICE

ICE Mortgage Technology ICE Mortgage Technology’s AVM (Automated Valuation Model) is a state-of-the-art online residential property valuation tool that provides a quick and accurate estimate of the value of almost any home in the U.S.

Not Available

ICE Mortgage Technology does not have data for the current month. Please view the chart for historical values.

First American

First American First American Data & Analytics’ next-generation AVM combines unrivaled data assets with a blended ensemble of valuation models to produce highly accurate, reliable valuations you can trust.

Not Available

First American does not have data for the current month. Please view the chart for historical values.

Quantarium

Quantarium Quantarium’s valuation service, repeatedly proven the industry’s most accurate and comprehensive, is supercharged with a self-learning and auto-tuning AI engine that continually becomes smarter and more accurate as it processes daily inputs from the industry’s leading RE data lake.

Not Available

Quantarium does not have data for the current month. Please view the chart for historical values.

Average Value
Not Available
List Price
Sold Price
Create a Home Valuation Report for This Property
The Home Valuation Report is an in-depth analysis detailing your home's value as well as a comparison with similar homes in the area

Home Values in the Area

Source: Public Records

Average Home Value in this Area


Source: Public Records

Purchase History

Date Buyer Sale Price Title Company
Dr Hoo Trust $61,579 None Listed On Document
Sga Multifamily Tel Llc -- Bridgetrust Title Group
Powerful Intentions Llc $97,300 None Available
Machkaez Real Estate Investors Llc $87,500 None Available
Sga Multifamily Tel Llc $140,000 Bridgetrust Title Group
Hopkins Harry $15,000 --
Hopkins Harry $15,000 Not Available
Source: Public Records

Tax History Compared to Growth

Source: Public Records

Tax History

Year Tax Paid Tax Assessment Tax Assessment Total Assessment is a certain percentage of the fair market value that is determined by local assessors to be the total taxable value of land and additions on the property. Land Improvement
2024 $1,355 $53,370 $2,910 $50,460
2023 $1,521 $51,341 $2,425 $48,916
2022 $1,183 $34,172 $3,604 $30,568
2021 $1,299 $34,172 $3,604 $30,568
2020 $1,327 $34,172 $3,604 $30,568
2019 $985 $25,152 $4,240 $20,912
2018 $2,009 $22,495 $4,240 $18,255
2017 $580 $22,469 $4,240 $18,229
2016 $535 $22,469 $4,240 $18,229
2015 $758 $22,469 $4,240 $18,229
2014 $1,265 $22,469 $4,240 $18,229
Source: Public Records

Map