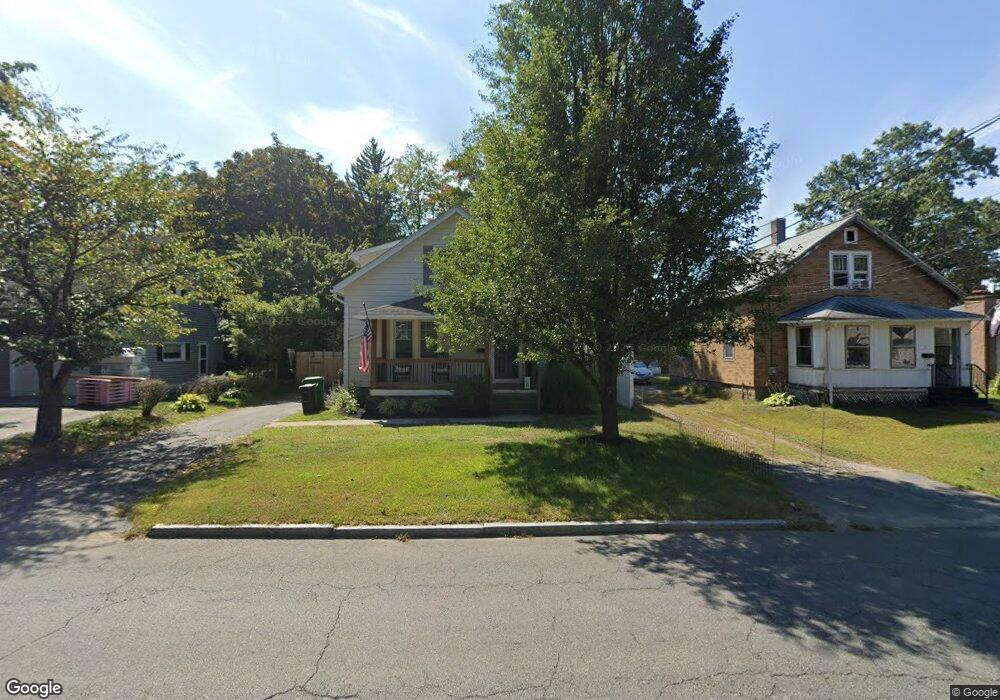
372 James St Chicopee, MA 01020
Fairview NeighborhoodEstimated Value: $285,947 - $343,000
2
Beds
1
Bath
1,304
Sq Ft
$245/Sq Ft
Est. Value
About This Home
This home is located at 372 James St, Chicopee, MA 01020 and is currently estimated at $319,237, approximately $244 per square foot. 372 James St is a home located in Hampden County with nearby schools including Streiber Elementary School, Fairview Middle School, and Chicopee Comprehensive High School.
Ownership History
Date
Name
Owned For
Owner Type
Purchase Details
Closed on
Apr 19, 2022
Sold by
Batchelor Jeffrey J
Bought by
Batchelor Jeffrey J and Batchelor Sara A
Current Estimated Value
Home Financials for this Owner
Home Financials are based on the most recent Mortgage that was taken out on this home.
Original Mortgage
$175,000
Outstanding Balance
$158,001
Interest Rate
3.76%
Mortgage Type
New Conventional
Estimated Equity
$161,236
Purchase Details
Closed on
Nov 20, 2009
Sold by
Alvaro Jessica L
Bought by
Batchelor Jeffrey J
Home Financials for this Owner
Home Financials are based on the most recent Mortgage that was taken out on this home.
Original Mortgage
$172,812
Interest Rate
4.86%
Mortgage Type
Purchase Money Mortgage
Purchase Details
Closed on
Dec 6, 2004
Sold by
Squires Donnell David
Bought by
Alvaro Jessica L
Home Financials for this Owner
Home Financials are based on the most recent Mortgage that was taken out on this home.
Original Mortgage
$153,225
Interest Rate
5.69%
Mortgage Type
VA
Purchase Details
Closed on
Jul 19, 2002
Sold by
Lords Lloyd and Lords Nicole
Bought by
Squires Donnel D
Purchase Details
Closed on
Feb 25, 1998
Sold by
Department Of Housing & Urban Dev
Bought by
Lords Lloyd and Lords Nicole
Purchase Details
Closed on
Sep 4, 1997
Sold by
Deforge Mark A
Bought by
Fleet Mtg Corp
Create a Home Valuation Report for This Property
The Home Valuation Report is an in-depth analysis detailing your home's value as well as a comparison with similar homes in the area
Home Values in the Area
Average Home Value in this Area
Purchase History
| Date | Buyer | Sale Price | Title Company |
|---|---|---|---|
| Batchelor Jeffrey J | -- | None Available | |
| Batchelor Jeffrey J | -- | None Available | |
| Batchelor Jeffrey J | $176,000 | -- | |
| Alvaro Jessica L | $156,000 | -- | |
| Squires Donnel D | $120,000 | -- | |
| Lords Lloyd | $60,400 | -- | |
| Fleet Mtg Corp | $101,359 | -- | |
| Batchelor Jeffrey J | $176,000 | -- | |
| Alvaro Jessica L | $156,000 | -- | |
| Squires Donnel D | $120,000 | -- | |
| Lords Lloyd | $60,400 | -- | |
| Fleet Mtg Corp | $101,359 | -- |
Source: Public Records
Mortgage History
| Date | Status | Borrower | Loan Amount |
|---|---|---|---|
| Open | Batchelor Jeffrey J | $175,000 | |
| Closed | Batchelor Jeffrey J | $175,000 | |
| Previous Owner | Batchelor Jeffrey J | $172,812 | |
| Previous Owner | Alvaro Jessica L | $153,225 |
Source: Public Records
Tax History
| Year | Tax Paid | Tax Assessment Tax Assessment Total Assessment is a certain percentage of the fair market value that is determined by local assessors to be the total taxable value of land and additions on the property. | Land | Improvement |
|---|---|---|---|---|
| 2025 | $3,406 | $224,700 | $107,400 | $117,300 |
| 2024 | $3,234 | $219,100 | $105,300 | $113,800 |
| 2023 | $2,985 | $197,000 | $95,700 | $101,300 |
| 2022 | $2,846 | $167,500 | $83,200 | $84,300 |
| 2021 | $2,693 | $152,900 | $75,700 | $77,200 |
| 2020 | $2,612 | $149,600 | $77,700 | $71,900 |
| 2019 | $2,590 | $144,200 | $77,700 | $66,500 |
| 2018 | $2,523 | $137,800 | $74,000 | $63,800 |
| 2017 | $2,489 | $143,800 | $68,500 | $75,300 |
| 2016 | $2,469 | $146,000 | $68,500 | $77,500 |
| 2015 | $2,543 | $145,000 | $68,500 | $76,500 |
| 2014 | $1,272 | $145,000 | $68,500 | $76,500 |
Source: Public Records
Map
Nearby Homes
Your Personal Tour Guide
Ask me questions while you tour the home.