372 Oatgrass Dr Unit /3 Grayson, GA 30017
Estimated Value: $620,000 - $649,378
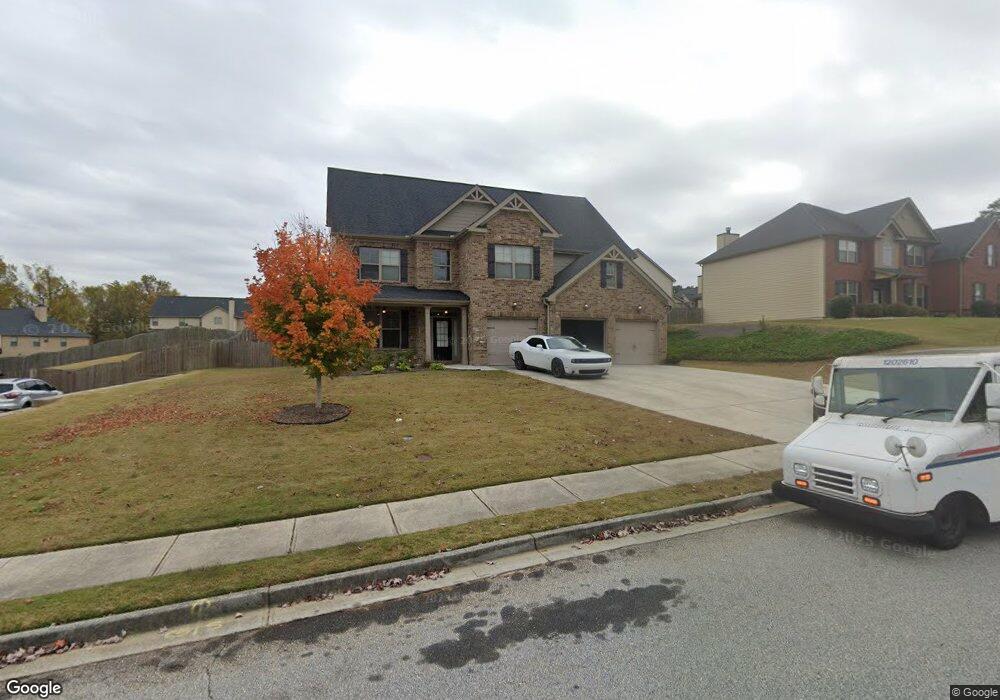
About This Home
This home is located at 372 Oatgrass Dr Unit /3, Grayson, GA 30017 and is currently estimated at $641,095, approximately $148 per square foot. 372 Oatgrass Dr Unit /3 is a home located in Gwinnett County with nearby schools including Starling Elementary School, Couch Middle School, and Grayson High School.
Ownership History
We collect this data history from publicly available records. To have your information removed, we recommend requesting removal directly through your county’s website.
Purchase Details
Home Financials for this Owner
Home Financials are based on the most recent Mortgage that was taken out on this home.Purchase Details
Home Financials for this Owner
Home Financials are based on the most recent Mortgage that was taken out on this home.Purchase Details
Home Values in the Area
Average Home Value in this Area
Purchase History
We collect this data history from publicly available records. To have your information removed, we recommend requesting removal directly through your county’s website.
| Date | Buyer | Sale Price | Title Company |
|---|---|---|---|
| $482,300 | -- | ||
| $348,110 | -- | ||
| $200,000 | -- |
Mortgage History
We collect this data history from publicly available records. To have your information removed, we recommend requesting removal directly through your county’s website.
| Date | Status | Borrower | Loan Amount |
|---|---|---|---|
| Open | $458,185 | ||
| Previous Owner | $341,804 |
Tax History
We collect this data history from publicly available records. To have your information removed, we recommend requesting removal directly through your county’s website.
| Year | Tax Paid | Tax Assessment Tax Assessment Total Assessment is a certain percentage of the fair market value that is determined by local assessors to be the total taxable value of land and additions on the property. | Land | Improvement |
|---|---|---|---|---|
| 2025 | $10,181 | $279,200 | $36,000 | $243,200 |
| 2024 | $9,963 | $269,840 | $36,000 | $233,840 |
| 2023 | $9,963 | $258,120 | $40,000 | $218,120 |
| 2022 | $7,220 | $192,920 | $37,200 | $155,720 |
| 2021 | $5,857 | $171,320 | $30,400 | $140,920 |
| 2020 | $5,594 | $157,320 | $28,000 | $129,320 |
| 2019 | $5,406 | $157,320 | $28,000 | $129,320 |
| 2018 | $5,022 | $139,240 | $20,000 | $119,240 |
| 2016 | $688 | $18,000 | $18,000 | $0 |
| 2015 | $691 | $18,000 | $18,000 | $0 |
| 2014 | -- | $10,000 | $10,000 | $0 |
Map
- 339 Oatgrass Dr
- 176 Cypress Cove Ct
- 12 Wild Oat Ct
- 21 Wild Oat Ct
- 536 Sageton Ct
- 1680 Mcconnell Rd SE
- 1682 Mcconnell Rd SE
- 1684 Mcconnell Rd SE
- 1686 Mcconnell Rd SE
- 1688 Mcconnell Rd SE
- 298 Ryston Way
- 1393 Sutters Walk
- 1345 Chandler Rd Unit 1
- 1762 Dover Creek Ln
- 338 Ryston Way
- 1682 Dover Creek Ln
- 145 Millennial Ct
- 295 Helens Manor Dr
- 1495 Bowman Rd
- 1381 Gateswalk Path
- 372 Oatgrass Dr Unit 3B
- 372 Oatgrass Dr
- 362 Oatgrass Dr
- 412 Oatgrass Dr Unit 2B
- 412 Oatgrass Dr
- 432 Oatgrass Dr
- 432 Oatgrass Dr Unit 1B
- 379 Oatgrass Dr Unit 32A
- 382 Oatgrass Dr Unit 2
- 382 Oatgrass Dr Unit 2B
- 382 Oatgrass Dr
- 312 Oatgrass Dr Unit 6B
- 312 Oatgrass Dr
- 389 Oatgrass Dr Unit 31A
- 389 Oatgrass Dr
- 352 Oatgrass Dr Unit 5B
- 352 Oatgrass Dr
- 369 Oatgrass Dr Unit 33
- 369 Oatgrass Dr
- 272 Oatgrass Dr Unit 9B
Ask me questions while you tour the home.