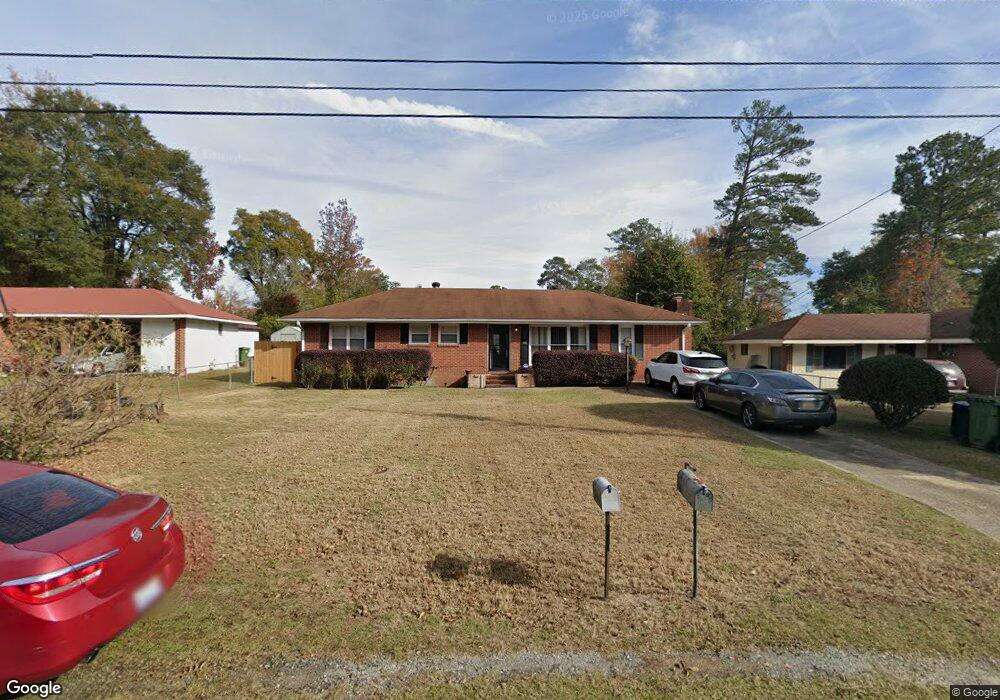
372 Olsen Ave Columbus, GA 31907
East Columbus NeighborhoodEstimated Value: $114,000 - $131,000
3
Beds
2
Baths
1,300
Sq Ft
$92/Sq Ft
Est. Value
About This Home
This home is located at 372 Olsen Ave, Columbus, GA 31907 and is currently estimated at $119,157, approximately $91 per square foot. 372 Olsen Ave is a home located in Muscogee County with nearby schools including Dimon Elementary School, Rothschild Leadership Academy, and Kendrick High School.
Ownership History
Date
Name
Owned For
Owner Type
Purchase Details
Closed on
Nov 18, 2021
Sold by
Robinson Mattie E
Bought by
Cole Andreaette Adams
Current Estimated Value
Home Financials for this Owner
Home Financials are based on the most recent Mortgage that was taken out on this home.
Original Mortgage
$66,000
Outstanding Balance
$51,206
Interest Rate
2.27%
Mortgage Type
New Conventional
Estimated Equity
$67,951
Purchase Details
Closed on
Mar 26, 2013
Sold by
Robinson Mattie E
Bought by
Robinson Mattie E and Cole Andreaette Adams
Home Financials for this Owner
Home Financials are based on the most recent Mortgage that was taken out on this home.
Original Mortgage
$57,538
Interest Rate
3.62%
Mortgage Type
FHA
Purchase Details
Closed on
Dec 17, 2012
Sold by
Gary Lavon Jefferson
Bought by
Gary Lavon Jefferson
Create a Home Valuation Report for This Property
The Home Valuation Report is an in-depth analysis detailing your home's value as well as a comparison with similar homes in the area
Home Values in the Area
Average Home Value in this Area
Purchase History
| Date | Buyer | Sale Price | Title Company |
|---|---|---|---|
| Cole Andreaette Adams | -- | -- | |
| Cole Andreaette Adams | -- | None Listed On Document | |
| Robinson Mattie E | $58,600 | -- | |
| Robinson Mattie E | $58,600 | -- | |
| Gary Lavon Jefferson | -- | -- |
Source: Public Records
Mortgage History
| Date | Status | Borrower | Loan Amount |
|---|---|---|---|
| Open | Cole Andreaette Adams | $66,000 | |
| Closed | Cole Andreaette Adams | $66,000 | |
| Previous Owner | Robinson Mattie E | $57,538 |
Source: Public Records
Tax History
| Year | Tax Paid | Tax Assessment Tax Assessment Total Assessment is a certain percentage of the fair market value that is determined by local assessors to be the total taxable value of land and additions on the property. | Land | Improvement |
|---|---|---|---|---|
| 2025 | $569 | $36,088 | $6,068 | $30,020 |
| 2024 | $568 | $36,088 | $6,068 | $30,020 |
| 2023 | $23 | $36,088 | $6,068 | $30,020 |
| 2022 | $592 | $27,728 | $6,068 | $21,660 |
| 2021 | $410 | $25,732 | $6,068 | $19,664 |
| 2020 | $411 | $25,732 | $6,068 | $19,664 |
| 2019 | $414 | $25,732 | $6,068 | $19,664 |
| 2018 | $414 | $25,732 | $6,068 | $19,664 |
| 2017 | $417 | $25,732 | $6,068 | $19,664 |
| 2016 | $419 | $23,440 | $3,834 | $19,606 |
| 2015 | $421 | $23,440 | $3,834 | $19,606 |
| 2014 | $422 | $23,440 | $3,834 | $19,606 |
| 2013 | -- | $33,651 | $3,834 | $29,817 |
Source: Public Records
Map
Nearby Homes
- 392 Olsen Ave
- 391 & 401 Victoria Dr
- 410 McCartha Dr
- 417 Wickham Dr
- 441 Braselman Ave
- 4801 Allen St
- 4525 Sentry St
- 349 Art Ave
- 4509 Sims St
- 4516 Sims St
- 5003 Shirley Ann Dr
- 643 Southern Pines Dr
- 5021 Shirley Ann Dr
- 4437 St Marys Rd
- 559 Chandler Dr
- 644 Georgia Dr
- 59 Apollo Dr
- 815 Englewood Dr
- 5201 Vincent Dr
- 4804 Bruning St
Your Personal Tour Guide
Ask me questions while you tour the home.