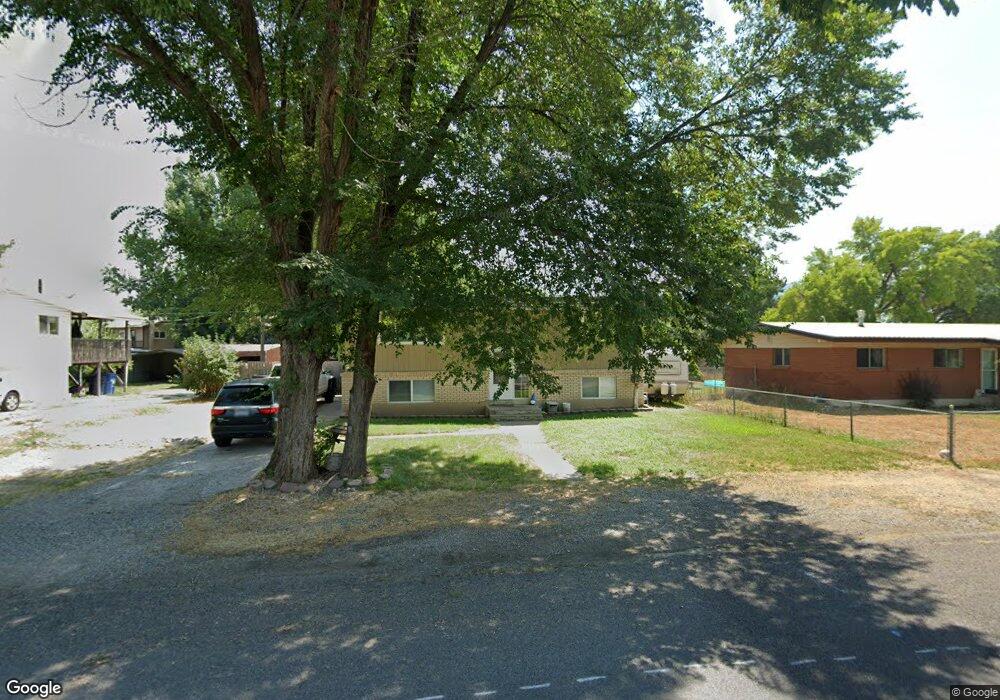
372 S 600 W Logan, UT 84321
Woodruff NeighborhoodEstimated Value: $354,000 - $394,000
4
Beds
1
Bath
1,936
Sq Ft
$192/Sq Ft
Est. Value
About This Home
This home is located at 372 S 600 W, Logan, UT 84321 and is currently estimated at $372,510, approximately $192 per square foot. 372 S 600 W is a home located in Cache County with nearby schools including Woodruff School, Mount Logan Middle School, and Logan High School.
Ownership History
Date
Name
Owned For
Owner Type
Purchase Details
Closed on
Aug 18, 2016
Sold by
Miller Dustin and Miller Steffany
Bought by
Yeoman Stephen and Jones Kari
Current Estimated Value
Home Financials for this Owner
Home Financials are based on the most recent Mortgage that was taken out on this home.
Original Mortgage
$149,148
Outstanding Balance
$121,568
Interest Rate
4.25%
Mortgage Type
FHA
Estimated Equity
$250,942
Purchase Details
Closed on
Feb 13, 2012
Sold by
Miller Dustin
Bought by
Miller Dustin and Miller Steffany
Home Financials for this Owner
Home Financials are based on the most recent Mortgage that was taken out on this home.
Original Mortgage
$88,650
Interest Rate
3.86%
Mortgage Type
New Conventional
Purchase Details
Closed on
Mar 8, 2006
Sold by
Peters Rita Annette
Bought by
Miller Dustin and Miller Steffany
Home Financials for this Owner
Home Financials are based on the most recent Mortgage that was taken out on this home.
Original Mortgage
$91,168
Interest Rate
6.08%
Mortgage Type
FHA
Create a Home Valuation Report for This Property
The Home Valuation Report is an in-depth analysis detailing your home's value as well as a comparison with similar homes in the area
Home Values in the Area
Average Home Value in this Area
Purchase History
| Date | Buyer | Sale Price | Title Company |
|---|---|---|---|
| Yeoman Stephen | -- | Northern Title | |
| Miller Dustin | -- | American Secure Title Logan | |
| Miller Dustin | -- | American Secure Title Logan | |
| Miller Dustin | -- | Advanced Title Co |
Source: Public Records
Mortgage History
| Date | Status | Borrower | Loan Amount |
|---|---|---|---|
| Open | Yeoman Stephen | $149,148 | |
| Previous Owner | Miller Dustin | $88,650 | |
| Previous Owner | Miller Dustin | $91,168 |
Source: Public Records
Tax History
| Year | Tax Paid | Tax Assessment Tax Assessment Total Assessment is a certain percentage of the fair market value that is determined by local assessors to be the total taxable value of land and additions on the property. | Land | Improvement |
|---|---|---|---|---|
| 2025 | $1,700 | $219,825 | $0 | $0 |
| 2024 | $1,744 | $218,520 | $0 | $0 |
| 2023 | $1,804 | $215,455 | $0 | $0 |
| 2022 | $1,599 | $178,330 | $0 | $0 |
| 2021 | $1,505 | $259,220 | $42,500 | $216,720 |
| 2020 | $1,439 | $223,100 | $42,500 | $180,600 |
| 2019 | $1,247 | $184,968 | $42,500 | $142,468 |
| 2018 | $1,205 | $163,236 | $42,500 | $120,736 |
| 2017 | $1,134 | $81,180 | $0 | $0 |
| 2016 | $1,175 | $81,180 | $0 | $0 |
| 2015 | $1,177 | $81,180 | $0 | $0 |
| 2014 | $877 | $66,925 | $0 | $0 |
| 2013 | -- | $66,925 | $0 | $0 |
Source: Public Records
Map
Nearby Homes
- 562 S 1215 W Unit 135
- 226 S 600 W
- 501 Southwest St
- 553 Center Ave
- 591 Southwest St
- 1400 S 940 W
- 952 W 330 S
- 207 Sunstone Cir
- 1031 W 350 S
- 339 W Center St
- 445 S 100 W Unit 5A
- 445 S 100 W
- 1099 Three Pointe Ave
- 263 W Center St
- 292 S 100 W
- 96 N 300 W
- 178 Riverwalk Cir
- 593 S 100 W
- 597 S 100 W
- 590 S 100 W
Your Personal Tour Guide
Ask me questions while you tour the home.