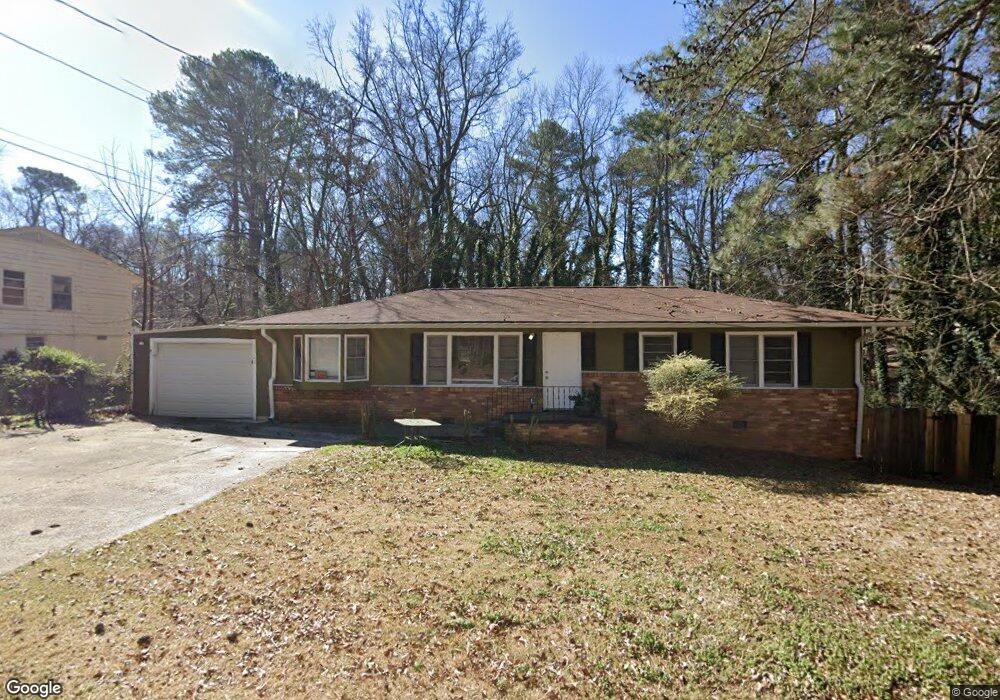
3720 Boulder Park Dr SW Unit 2 Atlanta, GA 30331
Fairburn Mays NeighborhoodEstimated Value: $162,381 - $233,000
4
Beds
2
Baths
1,025
Sq Ft
$193/Sq Ft
Est. Value
About This Home
This home is located at 3720 Boulder Park Dr SW Unit 2, Atlanta, GA 30331 and is currently estimated at $197,345, approximately $192 per square foot. 3720 Boulder Park Dr SW Unit 2 is a home located in Fulton County with nearby schools including L.P. Miles Elementary School, Young Middle School, and Mays High School.
Ownership History
Date
Name
Owned For
Owner Type
Purchase Details
Closed on
Jun 9, 2021
Sold by
Rntr 3 Llc
Bought by
Rm1 Sfr Propco A Lp
Current Estimated Value
Purchase Details
Closed on
Feb 20, 2014
Sold by
Global Logistics Resource
Bought by
Rntr 3 Llc
Purchase Details
Closed on
Apr 3, 2012
Sold by
Taylor Amelia
Bought by
Wells Fargo Bank Na
Purchase Details
Closed on
Sep 30, 2009
Sold by
Cook Nekia M
Bought by
Taylor Amelia
Home Financials for this Owner
Home Financials are based on the most recent Mortgage that was taken out on this home.
Original Mortgage
$84,452
Interest Rate
5.1%
Mortgage Type
FHA
Purchase Details
Closed on
Jul 28, 2008
Sold by
Wells Fargo Bk Na 2002 & 2
Bought by
Cook Nekia M
Purchase Details
Closed on
Apr 1, 2008
Sold by
Boykin Oscar L
Bought by
Wells Fargo Bank Na 2002 & 2
Create a Home Valuation Report for This Property
The Home Valuation Report is an in-depth analysis detailing your home's value as well as a comparison with similar homes in the area
Home Values in the Area
Average Home Value in this Area
Purchase History
| Date | Buyer | Sale Price | Title Company |
|---|---|---|---|
| Rm1 Sfr Propco A Lp | $7,627,325 | -- | |
| Rntr 3 Llc | $34,000 | -- | |
| Global Logistics Resource Inc | $27,102 | -- | |
| Wells Fargo Bank Na | -- | -- | |
| Taylor Amelia | $90,000 | -- | |
| Cook Nekia M | $20,000 | -- | |
| Wells Fargo Bank Na 2002 & 2 | $39,525 | -- |
Source: Public Records
Mortgage History
| Date | Status | Borrower | Loan Amount |
|---|---|---|---|
| Previous Owner | Taylor Amelia | $84,452 |
Source: Public Records
Tax History Compared to Growth
Tax History
| Year | Tax Paid | Tax Assessment Tax Assessment Total Assessment is a certain percentage of the fair market value that is determined by local assessors to be the total taxable value of land and additions on the property. | Land | Improvement |
|---|---|---|---|---|
| 2025 | $1,668 | $52,080 | $21,200 | $30,880 |
| 2023 | $2,164 | $52,280 | $21,000 | $31,280 |
| 2022 | $1,193 | $29,480 | $7,600 | $21,880 |
| 2021 | $1,159 | $28,600 | $7,360 | $21,240 |
| 2020 | $1,159 | $28,280 | $7,280 | $21,000 |
| 2019 | $497 | $22,640 | $5,560 | $17,080 |
| 2018 | $548 | $13,240 | $3,000 | $10,240 |
| 2017 | $371 | $8,600 | $2,560 | $6,040 |
| 2016 | $372 | $8,600 | $2,560 | $6,040 |
| 2015 | $889 | $8,600 | $2,560 | $6,040 |
| 2014 | $330 | $7,280 | $2,040 | $5,240 |
Source: Public Records
Map
Nearby Homes
- 3735 Boulder Park Dr SW
- 3680 Boulder Park Dr SW
- 3763 Boulder Park Dr SW
- 3697 Wisteria Ln SW
- 3790 Brook Way SW
- 261 Howell Terrace SW
- 3565 Boulder Park Dr SW
- 264 Howell Terrace SW
- 238 Howell Dr SW
- 405 Fairburn Rd SW Unit 176
- 405 Fairburn Rd SW Unit 27
- 405 Fairburn Rd SW Unit 268
- 405 Fairburn Rd SW Unit 143
- 405 Fairburn Rd SW Unit 223
- 3534 Boulder Park Dr SW
- 247 Howell Dr SW
- 745 Crestwell Cir SW
- 743 Crestwell Cir SW
- 865 Ambient Way SW
- 3720 Boulder Park Dr SW
- 3720 Boulder Park Dr SW
- 3700 Boulder Park Dr SW
- 3694 Boulder Park Dr SW
- 3746 Boulder Park Dr SW
- 3690 Boulder Park Dr SW
- 0 SW Boulder Pa Unit 8017435
- 3705 Boulder Park Dr SW
- 3724 Boulder Park Dr SW
- 3725 Boulder Park Dr SW
- 3695 Boulder Park Dr SW
- 3755 Boulder Park Dr SW
- 3756 Boulder Park Dr SW
- 3680 Fairburn Rd SW
- 225 Fairburn Rd SW
- 251 Fairburn Rd SW
- 3764 Boulder Park Dr SW
- 219 Fairburn Rd SW
- 3774 Boulder Park Dr SW
- 201 Fairburn Rd SW