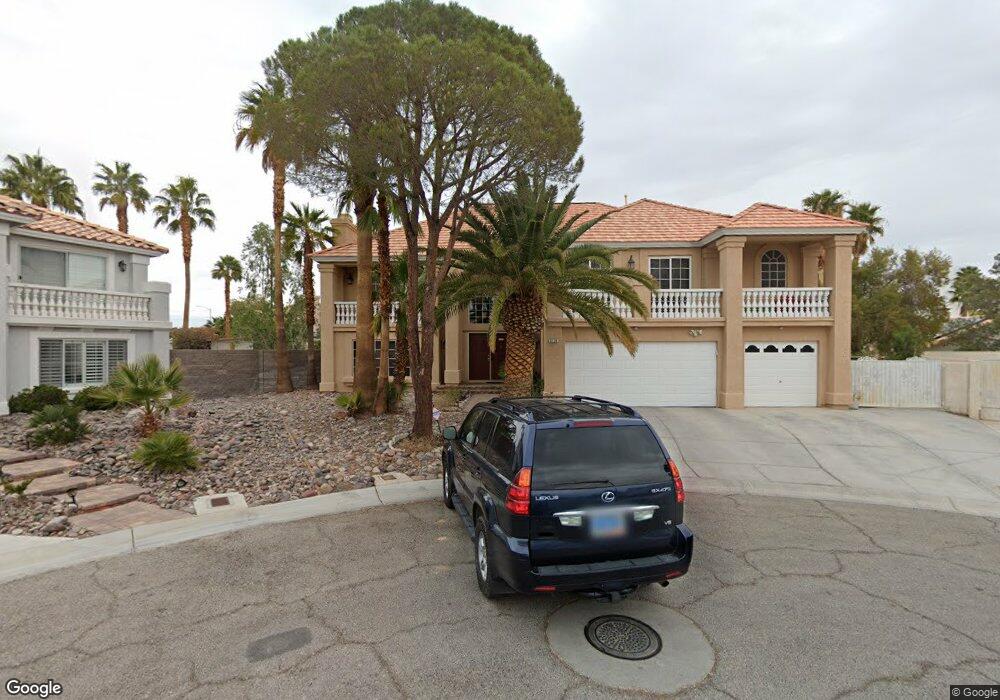
3720 Moss Ridge Ct Las Vegas, NV 89147
Rancho Viejo NeighborhoodEstimated Value: $779,809 - $915,000
7
Beds
5
Baths
4,658
Sq Ft
$182/Sq Ft
Est. Value
About This Home
This home is located at 3720 Moss Ridge Ct, Las Vegas, NV 89147 and is currently estimated at $846,452, approximately $181 per square foot. 3720 Moss Ridge Ct is a home located in Clark County with nearby schools including Patricia A Bendorf Elementary School, Clifford J Lawrence Junior High School, and Spring Valley High School.
Ownership History
Date
Name
Owned For
Owner Type
Purchase Details
Closed on
Nov 28, 2016
Sold by
Alexie Liliana Claudia
Bought by
Alexie Liliana Claudia and Fdm Irrevocable Trust
Current Estimated Value
Purchase Details
Closed on
Jun 25, 2003
Sold by
Alexie Ion and Alexie Liliana Claudia
Bought by
Alexie Liliana Claudia
Purchase Details
Closed on
Sep 12, 2002
Sold by
Gehrs Stephen W
Bought by
Alexie Ion and Alexie Liliana C
Home Financials for this Owner
Home Financials are based on the most recent Mortgage that was taken out on this home.
Original Mortgage
$296,000
Outstanding Balance
$114,690
Interest Rate
5.25%
Estimated Equity
$731,762
Purchase Details
Closed on
Sep 20, 1995
Sold by
Gehrs Stephen W
Bought by
Gehrs Stephen W
Home Financials for this Owner
Home Financials are based on the most recent Mortgage that was taken out on this home.
Original Mortgage
$230,000
Interest Rate
4.87%
Purchase Details
Closed on
Feb 2, 1995
Sold by
Gehrs Stephen W
Bought by
Gehrs Md Stephen W
Create a Home Valuation Report for This Property
The Home Valuation Report is an in-depth analysis detailing your home's value as well as a comparison with similar homes in the area
Home Values in the Area
Average Home Value in this Area
Purchase History
| Date | Buyer | Sale Price | Title Company |
|---|---|---|---|
| Alexie Liliana Claudia | -- | None Available | |
| Alexie Liliana Claudia | -- | -- | |
| Alexie Ion | $371,000 | First American Title Co | |
| Gehrs Stephen W | -- | First American Title Co | |
| Gehrs Md Stephen W | -- | -- |
Source: Public Records
Mortgage History
| Date | Status | Borrower | Loan Amount |
|---|---|---|---|
| Open | Alexie Ion | $296,000 | |
| Previous Owner | Gehrs Stephen W | $230,000 |
Source: Public Records
Tax History Compared to Growth
Tax History
| Year | Tax Paid | Tax Assessment Tax Assessment Total Assessment is a certain percentage of the fair market value that is determined by local assessors to be the total taxable value of land and additions on the property. | Land | Improvement |
|---|---|---|---|---|
| 2025 | $4,437 | $203,938 | $63,700 | $140,238 |
| 2024 | $4,308 | $203,938 | $63,700 | $140,238 |
| 2023 | $4,308 | $193,235 | $59,150 | $134,085 |
| 2022 | $4,585 | $167,824 | $44,800 | $123,024 |
| 2021 | $4,246 | $159,545 | $42,000 | $117,545 |
| 2020 | $3,940 | $158,824 | $42,000 | $116,824 |
| 2019 | $3,692 | $152,465 | $36,750 | $115,715 |
| 2018 | $3,523 | $142,638 | $31,500 | $111,138 |
| 2017 | $4,185 | $142,689 | $29,400 | $113,289 |
| 2016 | $3,297 | $136,446 | $23,100 | $113,346 |
| 2015 | $3,291 | $108,874 | $19,600 | $89,274 |
| 2014 | $3,195 | $113,209 | $17,500 | $95,709 |
Source: Public Records
Map
Nearby Homes
- 3774 Emerald Bay Cir
- 3609 Calico Cove Ct
- 3691 Luminal Ln
- 8886 Blake Alan Ave
- 8887 Mia Moore Ave
- 9070 Spring Mountain Rd Unit S202
- 9070 Spring Mountain Rd Unit 114
- 9272 W Viking Rd
- 3450 Erva St Unit 250
- 3450 Erva St Unit 207
- 8983 Emerald Waters Ct
- 3559 S Dapple Gray Rd
- 3455 Erva St Unit 219
- 9270 Apache Springs Dr
- 3730 Ruskin St
- 8753 Fountain Island Dr
- 9334 Peace Pipe Ct
- 3350 Stacey Lyn Dr
- 3891 Lilac Haze St
- 9337 Horizon Vista Ln
- 3730 Moss Ridge Ct
- 3721 Moss Ridge Ct
- 3719 Amber Lantern Cir
- 3729 Amber Lantern Cir
- 3729 Amber Lantern Cir Unit 3729
- 3729 Amber Lantern Cir Unit 999
- 3731 Moss Ridge Ct
- 3686 Dutch Valley Dr
- 3740 Moss Ridge Ct
- 9031 Kingsdale Ct
- 9041 Kingsdale Ct
- 3739 Amber Lantern Cir
- 3741 Moss Ridge Ct
- 9081 Ivory Beach Dr
- 3722 Lone Mesa Dr
- 3732 Lone Mesa Dr
- 3750 Moss Ridge Ct
- 3676 Dutch Valley Dr
- 3718 Amber Lantern Cir
- 9021 Kingsdale Ct