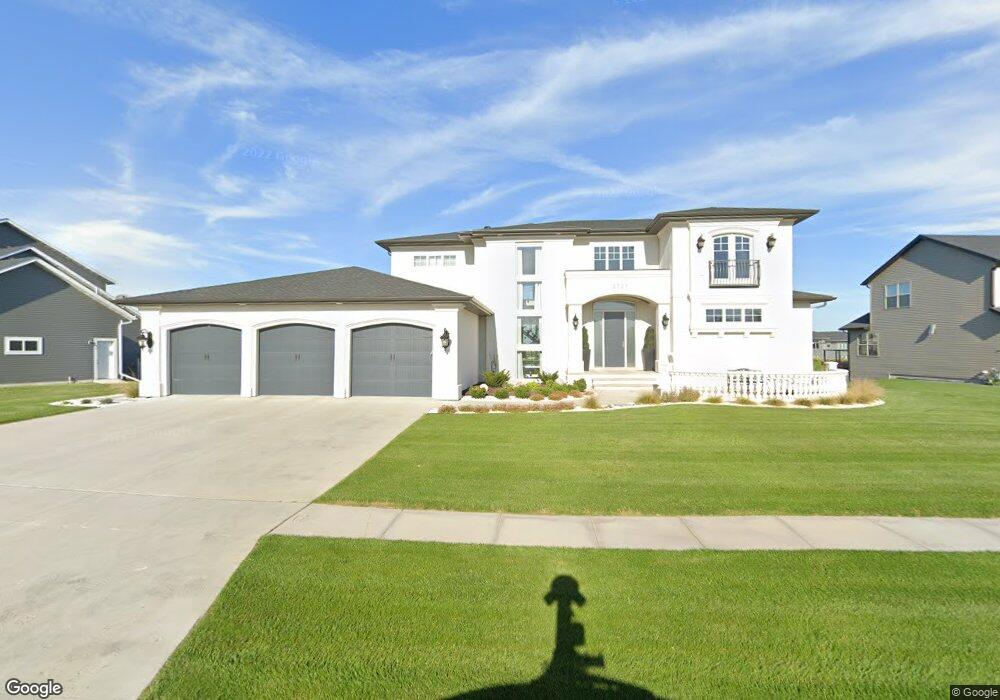
3721 4th St E West Fargo, ND 58078
Shadow Wood-Shadow Creek NeighborhoodEstimated Value: $1,827,672
4
Beds
4
Baths
2,938
Sq Ft
$622/Sq Ft
Est. Value
About This Home
This home is located at 3721 4th St E, West Fargo, ND 58078 and is currently estimated at $1,827,672, approximately $622 per square foot. 3721 4th St E is a home with nearby schools including Liberty Middle School, West Fargo Sheyenne High School, and Trinity Elementary School.
Ownership History
Date
Name
Owned For
Owner Type
Purchase Details
Closed on
Jun 16, 2017
Sold by
Building Concept Inc
Bought by
Dreger Brody R
Current Estimated Value
Home Financials for this Owner
Home Financials are based on the most recent Mortgage that was taken out on this home.
Original Mortgage
$820,000
Outstanding Balance
$676,965
Interest Rate
3.75%
Mortgage Type
Adjustable Rate Mortgage/ARM
Estimated Equity
$1,150,707
Purchase Details
Closed on
Sep 6, 2016
Sold by
Shadow Creek Development Iii Llc
Bought by
Clarys Steve and Clarys Sarar
Home Financials for this Owner
Home Financials are based on the most recent Mortgage that was taken out on this home.
Original Mortgage
$71,910
Interest Rate
3.43%
Mortgage Type
Commercial
Create a Home Valuation Report for This Property
The Home Valuation Report is an in-depth analysis detailing your home's value as well as a comparison with similar homes in the area
Home Values in the Area
Average Home Value in this Area
Purchase History
| Date | Buyer | Sale Price | Title Company |
|---|---|---|---|
| Dreger Brody R | $1,182,096 | None Available | |
| Clarys Steve | $29,900 | Title Co |
Source: Public Records
Mortgage History
| Date | Status | Borrower | Loan Amount |
|---|---|---|---|
| Open | Dreger Brody R | $820,000 | |
| Previous Owner | Clarys Steve | $71,910 |
Source: Public Records
Tax History
| Year | Tax Paid | Tax Assessment Tax Assessment Total Assessment is a certain percentage of the fair market value that is determined by local assessors to be the total taxable value of land and additions on the property. | Land | Improvement |
|---|---|---|---|---|
| 2024 | $19,212 | $579,900 | $89,150 | $490,750 |
| 2023 | $19,518 | $556,700 | $89,150 | $467,550 |
| 2022 | $19,343 | $518,050 | $89,150 | $428,900 |
| 2021 | $18,917 | $485,700 | $78,650 | $407,050 |
| 2020 | $18,567 | $483,100 | $78,650 | $404,450 |
| 2019 | $19,006 | $492,450 | $78,650 | $413,800 |
| 2018 | $18,839 | $496,650 | $78,650 | $418,000 |
| 2017 | $10,017 | $161,450 | $78,650 | $82,800 |
| 2016 | $7,192 | $55,050 | $55,050 | $0 |
| 2015 | $5,153 | $28,750 | $28,750 | $0 |
| 2014 | $3,076 | $28,750 | $28,750 | $0 |
| 2013 | $2,221 | $350 | $350 | $0 |
Source: Public Records
Map
Nearby Homes
- 3605 Houkom Dr E
- 412 38th Ave E
- 3644 6th St E
- 414 Westview Ln E
- 3839 Reserve Dr E
- 3878 3rd St E
- 3731 Hidden Cir
- 3463 Loberg Dr
- 229 36 1 2 Avenue Place E
- 6511 Osgood Pkwy S
- 4195 Furnberg Place S
- 717 35th Ave E
- 246 34th Ave E
- 3321 6th Way E Unit D
- 4355 66th St S
- 5594 Justice Dr S
- 433 Foxtail Dr
- 528 Prescott Ln
- 445 E Foxtail Dr
- 9350 & 9124 57th St S
- 3737 4th St E
- 3767 Houkom Dr E
- 3724 4th St E
- 3745 4th St E
- 3653 4th St E
- 3706 4th St E
- 3774 Houkom Dr E
- 3757 4th St E
- 3670 4th St E
- 3768 Houkom Dr E
- 3749 Houkom Dr E
- 3719 Houkom Dr E
- 3664 4th St E
- 3713 Houkom Dr E
- 3707 Houkom Dr E
- 3756 Houkom Dr E
- 3765 4th St E
- 3743 Houkom Dr E
- 3740 6th St E
- 3701 Houkom Dr E
Your Personal Tour Guide
Ask me questions while you tour the home.