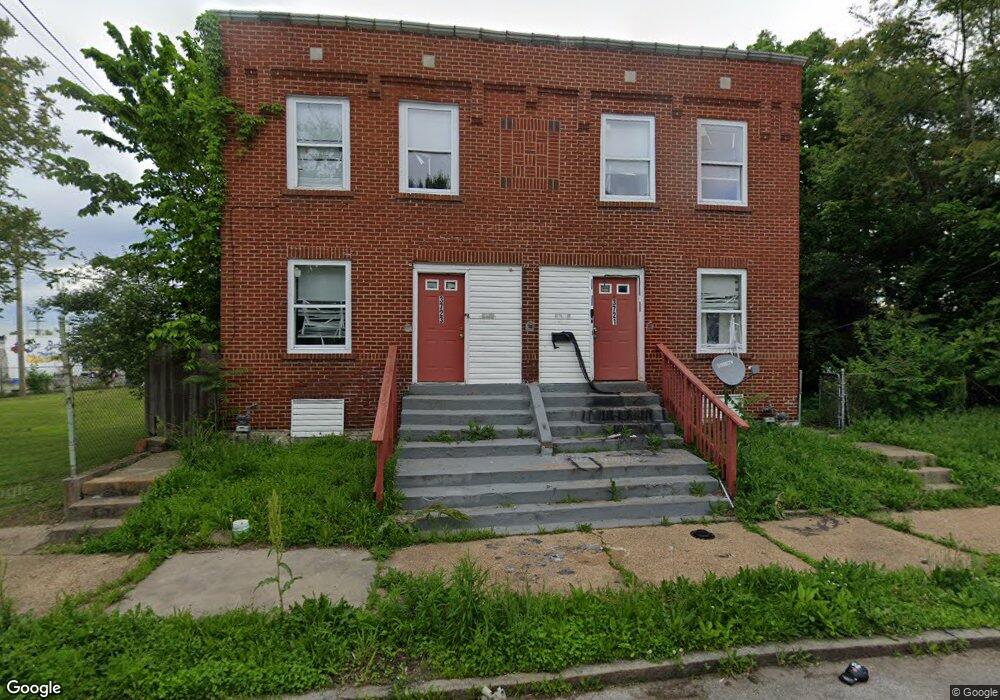
3721 Cozens Ave Saint Louis, MO 63113
Grand Center NeighborhoodEstimated Value: $50,000 - $124,636
--
Bed
4
Baths
3,240
Sq Ft
$28/Sq Ft
Est. Value
About This Home
This home is located at 3721 Cozens Ave, Saint Louis, MO 63113 and is currently estimated at $91,659, approximately $28 per square foot. 3721 Cozens Ave is a home located in St. Louis City with nearby schools including Dunbar Elementary School, Yeatman-Liddell Middle School, and Vashon High School.
Ownership History
Date
Name
Owned For
Owner Type
Purchase Details
Closed on
Jul 15, 2025
Sold by
Sheriff Of The City Of St Louis Missouri
Bought by
Franks Lamont
Current Estimated Value
Purchase Details
Closed on
Oct 1, 2014
Sold by
Mcm Asset Management Llc
Bought by
Anthony Best Construction Llc
Home Financials for this Owner
Home Financials are based on the most recent Mortgage that was taken out on this home.
Original Mortgage
$18,000
Interest Rate
4.12%
Mortgage Type
Future Advance Clause Open End Mortgage
Purchase Details
Closed on
Jun 9, 2011
Sold by
Lenord Rev James and Lenord Ruby Lee
Bought by
Executive Real Estate Acquisitions Llc
Purchase Details
Closed on
Aug 9, 2009
Sold by
The Advantage Group Lc
Bought by
Executive Real Estate Acquisitions Llc
Purchase Details
Closed on
Feb 1, 2009
Sold by
Advantage Loans Llc
Bought by
The Advantage Group Lc
Purchase Details
Closed on
Jul 15, 2008
Sold by
Hsbc Bank Usa Na
Bought by
Abc Holdings Group Inc
Home Financials for this Owner
Home Financials are based on the most recent Mortgage that was taken out on this home.
Original Mortgage
$9,300
Interest Rate
6.47%
Mortgage Type
Purchase Money Mortgage
Purchase Details
Closed on
Mar 27, 2008
Sold by
Underwood Shawn D
Bought by
Hsbc Bank Usa Na and Renaissance Home Equity Loan Trust 2007-
Purchase Details
Closed on
Feb 28, 2007
Sold by
Kp Construction Inc
Bought by
Underwood Shawn D
Home Financials for this Owner
Home Financials are based on the most recent Mortgage that was taken out on this home.
Original Mortgage
$79,900
Interest Rate
11.14%
Mortgage Type
Purchase Money Mortgage
Purchase Details
Closed on
May 12, 2006
Sold by
Ghan Jewyn Lc
Bought by
K P Construction Inc
Purchase Details
Closed on
Dec 10, 2004
Sold by
Deutsche Bank Trust Co Americas
Bought by
Gahn Jeway Llc
Purchase Details
Closed on
May 2, 2001
Sold by
Hutson Marilyn Lynett and Hutson Anna Hassan
Bought by
Hutson Marilyn Lynett
Home Financials for this Owner
Home Financials are based on the most recent Mortgage that was taken out on this home.
Original Mortgage
$34,000
Interest Rate
6.81%
Mortgage Type
Balloon
Purchase Details
Closed on
Mar 27, 2001
Sold by
Faith Baptist Lenord Rev James Pastor New Gre
Bought by
Hutson Marilyn Lynett
Home Financials for this Owner
Home Financials are based on the most recent Mortgage that was taken out on this home.
Original Mortgage
$34,000
Interest Rate
6.81%
Mortgage Type
Balloon
Create a Home Valuation Report for This Property
The Home Valuation Report is an in-depth analysis detailing your home's value as well as a comparison with similar homes in the area
Home Values in the Area
Average Home Value in this Area
Purchase History
| Date | Buyer | Sale Price | Title Company |
|---|---|---|---|
| Franks Lamont | $13,000 | None Listed On Document | |
| Franks Lamont | $13,000 | None Listed On Document | |
| Anthony Best Construction Llc | -- | None Available | |
| Anthony Best Construction Llc | -- | None Available | |
| Executive Real Estate Acquisitions Llc | -- | None Available | |
| Executive Real Estate Acquisitions Llc | -- | None Available | |
| The Advantage Group Lc | -- | None Available | |
| Abc Holdings Group Inc | -- | Mo Kan Title Services Inc | |
| Hsbc Bank Usa Na | $55,800 | None Available | |
| Underwood Shawn D | -- | Title Searches Inc | |
| K P Construction Inc | -- | Tristar Title Co Llc | |
| Gahn Jeway Llc | -- | -- | |
| Hutson Marilyn Lynett | -- | -- | |
| Hutson Marilyn Lynett | -- | -- |
Source: Public Records
Mortgage History
| Date | Status | Borrower | Loan Amount |
|---|---|---|---|
| Previous Owner | Anthony Best Construction Llc | $18,000 | |
| Previous Owner | Abc Holdings Group Inc | $9,300 | |
| Previous Owner | Underwood Shawn D | $79,900 | |
| Previous Owner | Hutson Marilyn Lynett | $34,000 |
Source: Public Records
Tax History Compared to Growth
Tax History
| Year | Tax Paid | Tax Assessment Tax Assessment Total Assessment is a certain percentage of the fair market value that is determined by local assessors to be the total taxable value of land and additions on the property. | Land | Improvement |
|---|---|---|---|---|
| 2025 | $381 | $4,350 | $1,060 | $3,290 |
| 2024 | $364 | $4,220 | $1,060 | $3,160 |
| 2023 | $364 | $4,220 | $1,060 | $3,160 |
| 2022 | $372 | $4,160 | $1,060 | $3,100 |
| 2021 | $371 | $4,160 | $1,060 | $3,100 |
| 2020 | $369 | $4,160 | $1,060 | $3,100 |
| 2019 | $368 | $4,160 | $1,060 | $3,100 |
| 2018 | $437 | $4,860 | $1,060 | $3,800 |
| 2017 | $430 | $4,860 | $1,060 | $3,800 |
| 2016 | $404 | $4,480 | $1,330 | $3,150 |
| 2015 | $368 | $4,480 | $1,330 | $3,150 |
| 2014 | $454 | $4,480 | $1,330 | $3,150 |
| 2013 | -- | $5,620 | $1,330 | $4,290 |
Source: Public Records
Map
Nearby Homes
- 3711 Aldine Ave
- 3632 Cook Ave
- 3761 Finney Ave
- 4318 Evans Ave
- 3936 Cook Ave
- 3849 Cottage Ave
- 3916 W Belle Place
- 4055 N Market St
- 2754 Bacon St
- 4047 Cottage Ave
- 4044 Enright Ave
- 4112 W Belle Place
- 4017 Maffitt Ave
- 2743 Madison St
- 3534 Washington Ave
- 1727 N Leffingwell Ave
- 4112 Enright Ave
- 3826 Olive St Unit Lot 7
- 4059 Maffitt Ave
- 1514 N Leffingwell Ave
- 3724 Dr Martin Luther King 3734 Dr
- 37243734 W Doctor Martin Luther King Dr
- 3736 Cozens Ave
- 3732 Cozens Ave
- 3732 Cozens Ave
- 3733 Evans Ave
- 3709 Evans Ave
- 3711 Evans Ave
- 3739 Evans Ave
- 3705 Evans Ave
- 3701 Cass Ave
- 3720 Evans Ave
- 3716 Evans Ave
- 3732 Evans Ave
- 3738 Evans Ave
- 3736 Evans Ave
- 3653 Cass Ave
- 3708 Aldine Ave
- 3712 Aldine Ave
- 3710 Aldine Ave