Estimated Value: $678,000 - $738,000
4
Beds
2
Baths
3,188
Sq Ft
$223/Sq Ft
Est. Value
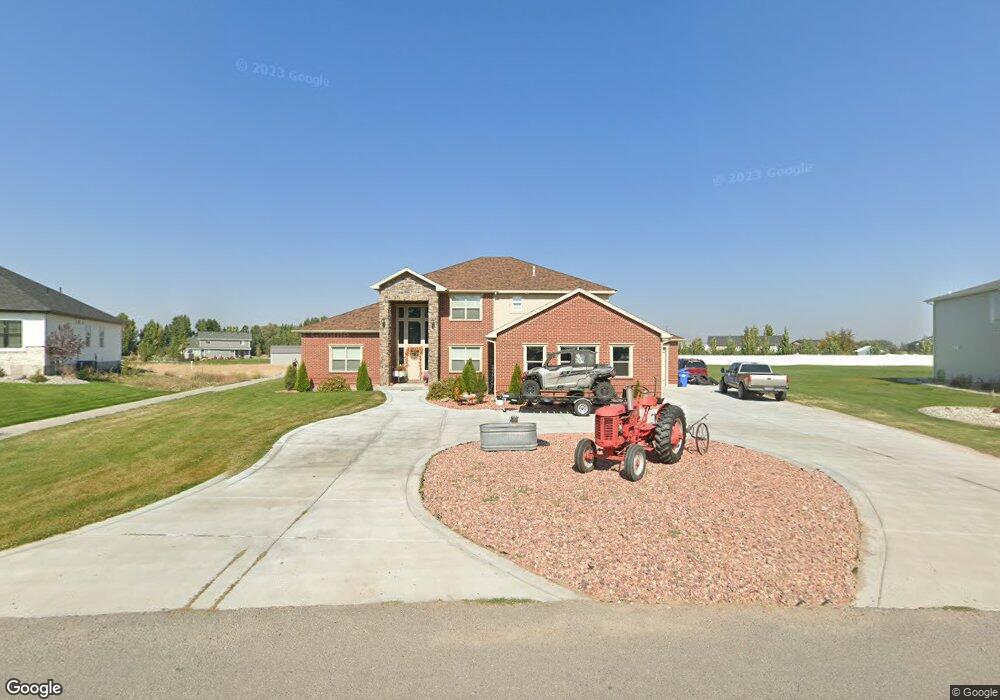
About This Home
This home is located at 3721 E 331 N, Rigby, ID 83442 and is currently estimated at $711,034, approximately $223 per square foot. 3721 E 331 N is a home with nearby schools including Jefferson Elementary School, Rigby Middle School, and Rigby High School.
Ownership History
Date
Name
Owned For
Owner Type
Purchase Details
Closed on
Dec 4, 2023
Sold by
Serrano Efren and Serrano Corrie
Bought by
Serrano Efren
Current Estimated Value
Home Financials for this Owner
Home Financials are based on the most recent Mortgage that was taken out on this home.
Original Mortgage
$50,000
Outstanding Balance
$45,958
Interest Rate
7.03%
Mortgage Type
New Conventional
Estimated Equity
$665,076
Purchase Details
Closed on
May 28, 2021
Sold by
Guzman Sergio and Rodriguez Maria Alondra
Bought by
Serrano Efren and Serrano Corrie
Home Financials for this Owner
Home Financials are based on the most recent Mortgage that was taken out on this home.
Original Mortgage
$548,250
Interest Rate
3%
Mortgage Type
New Conventional
Purchase Details
Closed on
Oct 31, 2016
Sold by
Fisher Susan M and Fisher David L
Bought by
Guzman Sergio and Rodriguez Maria Alondra
Purchase Details
Closed on
Sep 13, 2010
Sold by
Fisher Susan M
Bought by
Fisher Susan M and Fisher David L
Create a Home Valuation Report for This Property
The Home Valuation Report is an in-depth analysis detailing your home's value as well as a comparison with similar homes in the area
Purchase History
| Date | Buyer | Sale Price | Title Company |
|---|---|---|---|
| Serrano Efren | -- | Flying S Title And Escrow-Idah | |
| Serrano Efren | -- | Titleone Twin Falls | |
| Guzman Sergio | -- | First American Title Rigby | |
| Fisher Susan M | -- | -- |
Source: Public Records
Mortgage History
| Date | Status | Borrower | Loan Amount |
|---|---|---|---|
| Open | Serrano Efren | $50,000 | |
| Previous Owner | Serrano Efren | $548,250 |
Source: Public Records
Tax History
| Year | Tax Paid | Tax Assessment Tax Assessment Total Assessment is a certain percentage of the fair market value that is determined by local assessors to be the total taxable value of land and additions on the property. | Land | Improvement |
|---|---|---|---|---|
| 2025 | $1,458 | $666,353 | $0 | $0 |
| 2024 | $1,458 | $662,500 | $0 | $0 |
| 2023 | $2,292 | $712,910 | $0 | $0 |
| 2022 | $3,517 | $628,815 | $0 | $0 |
| 2021 | $2,830 | $427,968 | $0 | $0 |
| 2020 | $2,251 | $390,961 | $0 | $0 |
| 2019 | $2,461 | $342,326 | $0 | $0 |
| 2018 | $2,168 | $300,692 | $0 | $0 |
| 2017 | $342 | $32,000 | $0 | $0 |
| 2016 | $239 | $22,000 | $0 | $0 |
| 2015 | $203 | $18,000 | $0 | $0 |
| 2014 | $203 | $18,000 | $0 | $0 |
| 2013 | -- | $18,000 | $0 | $0 |
Source: Public Records
Map
Nearby Homes
Your Personal Tour Guide
Ask me questions while you tour the home.