Estimated Value: $126,000 - $148,000
3
Beds
2
Baths
1,300
Sq Ft
$107/Sq Ft
Est. Value
About This Home
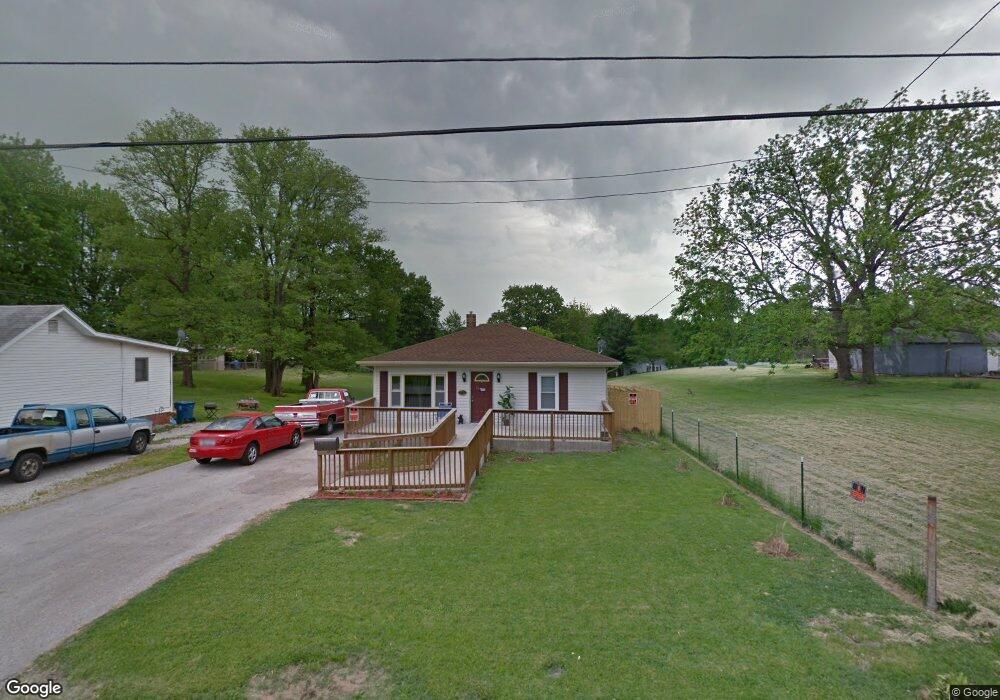
This home is located at 3721 Franor St, Alton, IL 62002 and is currently estimated at $139,678, approximately $107 per square foot. 3721 Franor St is a home located in Madison County with nearby schools including East Elementary School, Alton Middle School, and Alton High School.
Ownership History
Date
Name
Owned For
Owner Type
Purchase Details
Closed on
Jan 28, 2013
Sold by
Secretary Of Hud
Bought by
Mcnish Stacy J and Bohnenstiehl Sandra J
Current Estimated Value
Purchase Details
Closed on
Sep 26, 2012
Sold by
Wray Carol A
Bought by
Secretary Of Hud
Purchase Details
Closed on
Aug 24, 2007
Sold by
Drummet Brent A
Bought by
Wray Carol A
Home Financials for this Owner
Home Financials are based on the most recent Mortgage that was taken out on this home.
Original Mortgage
$89,900
Interest Rate
6.77%
Mortgage Type
Purchase Money Mortgage
Purchase Details
Closed on
Oct 29, 2003
Sold by
Baldwin Brandee M
Bought by
Drummet Brent A
Home Financials for this Owner
Home Financials are based on the most recent Mortgage that was taken out on this home.
Original Mortgage
$60,000
Interest Rate
6.04%
Mortgage Type
Purchase Money Mortgage
Create a Home Valuation Report for This Property
The Home Valuation Report is an in-depth analysis detailing your home's value as well as a comparison with similar homes in the area
Home Values in the Area
Average Home Value in this Area
Purchase History
| Date | Buyer | Sale Price | Title Company |
|---|---|---|---|
| Mcnish Stacy J | -- | Lakeshore Title Agency | |
| Secretary Of Hud | -- | None Available | |
| Wray Carol A | $90,000 | Premier Title & Escrow Co | |
| Drummet Brent A | $75,000 | Chicago Title |
Source: Public Records
Mortgage History
| Date | Status | Borrower | Loan Amount |
|---|---|---|---|
| Previous Owner | Wray Carol A | $89,900 | |
| Previous Owner | Drummet Brent A | $60,000 |
Source: Public Records
Tax History Compared to Growth
Tax History
| Year | Tax Paid | Tax Assessment Tax Assessment Total Assessment is a certain percentage of the fair market value that is determined by local assessors to be the total taxable value of land and additions on the property. | Land | Improvement |
|---|---|---|---|---|
| 2024 | $2,349 | $34,890 | $1,990 | $32,900 |
| 2023 | $2,349 | $31,510 | $1,800 | $29,710 |
| 2022 | $2,158 | $28,490 | $1,630 | $26,860 |
| 2021 | $1,903 | $26,770 | $1,530 | $25,240 |
| 2020 | $1,839 | $25,820 | $1,480 | $24,340 |
| 2019 | $1,889 | $25,240 | $1,450 | $23,790 |
| 2018 | $1,837 | $24,580 | $1,410 | $23,170 |
| 2017 | $1,798 | $24,580 | $1,410 | $23,170 |
| 2016 | $1,762 | $24,580 | $1,410 | $23,170 |
| 2015 | $1,689 | $24,580 | $1,410 | $23,170 |
| 2014 | $1,689 | $24,580 | $1,410 | $23,170 |
| 2013 | $1,689 | $25,250 | $1,450 | $23,800 |
Source: Public Records
Map
Nearby Homes
- 3723 Franor St
- 3871 Claremont St
- 3627 Horn Ave
- 3513 Coronado Dr
- 1201 Milton Rd
- 202 Wisconsin Ave
- 613 Leonard St
- 3537 Fullerton Ave
- 3407 Lincoln St
- 809 Maurice St
- 241 Herbert St
- 1705 S Rodgers Ave
- 2933 Forest Dr
- 620 Sheppard St
- 3303 Jackson St
- 3006 Watalee St
- 3304 Jackson St
- 1708 Lucille Ave
- 3013 Mayfield Ave
- 3302 College Ave
- 3717 Franor St
- 3753 Berkeley Ave
- 1142 Beaumont St
- 3755 Berkeley Ave
- 1148 Beaumont St
- 1136 Beaumont St
- 3751 Berkeley Ave
- 1154 Beaumont St
- 3749 Berkeley Ave
- 1130 Beaumont St
- 3715 Franor St
- 3747 Berkeley Ave
- 1160 Beaumont St
- 1124 Beaumont St
- 3735 Berkeley Ave
- 3817 Berkeley Ave
- 3713 Franor St
- 1118 Beaumont St
- 3733 Berkeley Ave
- 3718 Coronado Dr