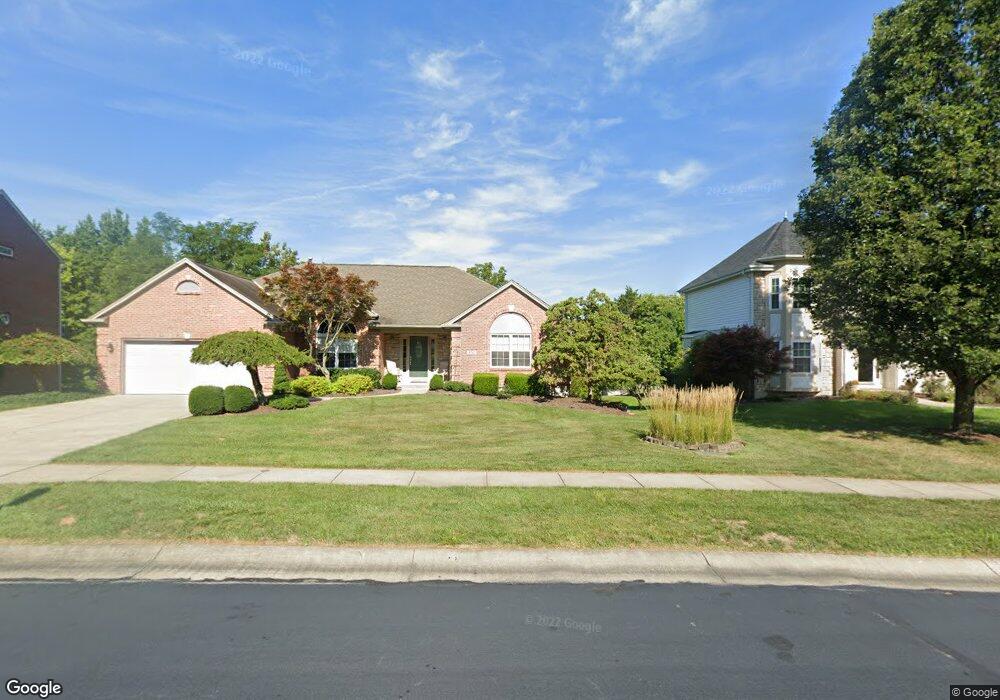
3721 Indian Brave Trail Cleves, OH 45002
Estimated Value: $424,117 - $515,000
3
Beds
2
Baths
2,047
Sq Ft
$231/Sq Ft
Est. Value
About This Home
This home is located at 3721 Indian Brave Trail, Cleves, OH 45002 and is currently estimated at $472,029, approximately $230 per square foot. 3721 Indian Brave Trail is a home located in Hamilton County with nearby schools including Charles T. Young Elementary School, Taylor Middle School, and Taylor High School.
Ownership History
Date
Name
Owned For
Owner Type
Purchase Details
Closed on
May 13, 2005
Sold by
Williams Roy and Williams Dawn M
Bought by
Mason Richard H and Mason Mary Ann
Current Estimated Value
Home Financials for this Owner
Home Financials are based on the most recent Mortgage that was taken out on this home.
Original Mortgage
$217,200
Outstanding Balance
$114,918
Interest Rate
6.07%
Mortgage Type
Unknown
Estimated Equity
$357,111
Purchase Details
Closed on
Jun 14, 2001
Sold by
Gary Thaler and Gary Patricia L
Bought by
Williams Roy and Williams Dawn M
Home Financials for this Owner
Home Financials are based on the most recent Mortgage that was taken out on this home.
Original Mortgage
$202,400
Interest Rate
7.18%
Purchase Details
Closed on
May 28, 1999
Sold by
Indian Walk Development Co
Bought by
Thaler Gary and Thaler Patricia L
Home Financials for this Owner
Home Financials are based on the most recent Mortgage that was taken out on this home.
Original Mortgage
$169,250
Interest Rate
7.12%
Create a Home Valuation Report for This Property
The Home Valuation Report is an in-depth analysis detailing your home's value as well as a comparison with similar homes in the area
Home Values in the Area
Average Home Value in this Area
Purchase History
| Date | Buyer | Sale Price | Title Company |
|---|---|---|---|
| Mason Richard H | -- | First Title Agency Inc | |
| Williams Roy | $253,000 | Insured Land Title Agency | |
| Thaler Gary | $54,000 | Tri-Star Title Agency Inc |
Source: Public Records
Mortgage History
| Date | Status | Borrower | Loan Amount |
|---|---|---|---|
| Open | Mason Richard H | $217,200 | |
| Closed | Williams Roy | $202,400 | |
| Previous Owner | Thaler Gary | $169,250 |
Source: Public Records
Tax History Compared to Growth
Tax History
| Year | Tax Paid | Tax Assessment Tax Assessment Total Assessment is a certain percentage of the fair market value that is determined by local assessors to be the total taxable value of land and additions on the property. | Land | Improvement |
|---|---|---|---|---|
| 2024 | $4,913 | $110,908 | $22,610 | $88,298 |
| 2023 | $4,749 | $110,908 | $22,610 | $88,298 |
| 2022 | $4,138 | $78,103 | $18,638 | $59,465 |
| 2021 | $4,014 | $78,103 | $18,638 | $59,465 |
| 2020 | $4,069 | $78,103 | $18,638 | $59,465 |
| 2019 | $4,244 | $75,828 | $18,095 | $57,733 |
| 2018 | $4,080 | $75,828 | $18,095 | $57,733 |
| 2017 | $3,820 | $75,828 | $18,095 | $57,733 |
| 2016 | $3,998 | $81,141 | $21,525 | $59,616 |
| 2015 | $4,048 | $81,141 | $21,525 | $59,616 |
| 2014 | $4,092 | $81,141 | $21,525 | $59,616 |
| 2013 | $4,006 | $81,141 | $21,525 | $59,616 |
Source: Public Records
Map
Nearby Homes
- 3736 Bremen Pass
- 8735 Bridgetown Rd
- 3894 Bremen Pass
- 8708 Quietwood Ln
- 3693 Chestnut Park Ln
- Chattanooga Plan at Indian Walk
- Rockford Plan at Indian Walk
- Carlisle Plan at Indian Walk
- Miramar Plan at Indian Walk
- The Hoover Plan at Indian Walk
- Truman Plan at Indian Walk
- The Jefferson Plan at Indian Walk
- Somerset Plan at Indian Walk
- The Longwood Plan at Indian Walk
- Sanibel Plan at Indian Walk
- Birmingham Plan at Indian Walk
- The Washington Plan at Indian Walk
- 3889 Bear Ln
- 525 E State Rd
- 8724 Deer Glen Ct
- 3717 Indian Brave Trail
- 3725 Indian Brave Trail
- 3733 Indian Brave Trail
- 3743 Fallen Timbers Way
- 3722 Indian Brave Trail
- 3714 Indian Brave Trail
- 3730 Indian Brave Trail
- 3756 Fallen Timbers Way
- 3746 Fallen Timbers Way
- 3745 Fallen Timbers Way
- 3739 Indian Brave Trail
- 3736 Indian Brave Trail
- 3754 Fallen Timbers Way
- 3749 Fallen Timbers Way
- 3749 Indian Brave Trail
- 3742 Indian Brave Trail
- 8610 Bridgetown Rd
- 3757 Indian Brave Trail
- 3757 Indian Mound Ave
- 8637 Bridgetown Rd