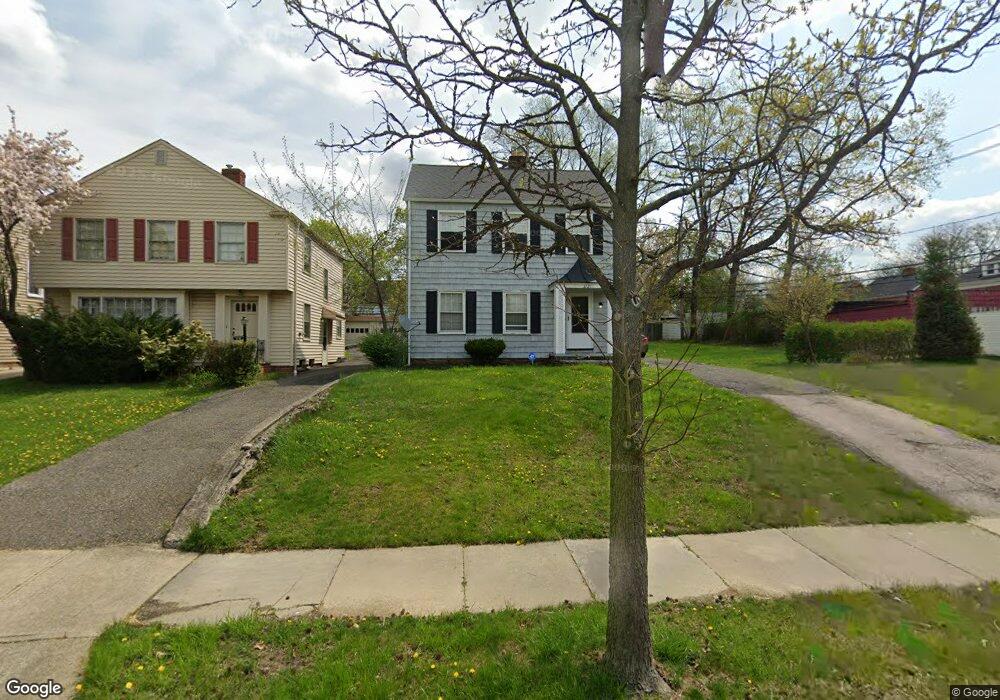
3721 Palmerston Rd Shaker Heights, OH 44122
Estimated Value: $217,000 - $233,000
3
Beds
1
Bath
1,352
Sq Ft
$166/Sq Ft
Est. Value
About This Home
This home is located at 3721 Palmerston Rd, Shaker Heights, OH 44122 and is currently estimated at $224,288, approximately $165 per square foot. 3721 Palmerston Rd is a home located in Cuyahoga County with nearby schools including Lomond Elementary School, Woodbury Elementary School, and Shaker Heights Middle School.
Ownership History
Date
Name
Owned For
Owner Type
Purchase Details
Closed on
Aug 9, 2021
Sold by
East Buildings Llc
Bought by
Georgene Camille Lambert Taylor Trust
Current Estimated Value
Purchase Details
Closed on
Dec 21, 2004
Sold by
Mrn Lp
Bought by
East Buildings Llc
Purchase Details
Closed on
Jul 3, 1991
Bought by
Mrn Limited Partnership
Purchase Details
Closed on
Oct 10, 1990
Bought by
M R N Company
Purchase Details
Closed on
Apr 26, 1990
Sold by
Walker Gracie
Bought by
Sec. Of H.U.D.
Purchase Details
Closed on
Jun 18, 1984
Sold by
Mitchell Yvonne L
Bought by
Walker Gracie
Purchase Details
Closed on
Aug 18, 1978
Sold by
Beard William and Beard Mary B
Bought by
Mitchell Yvonne L
Purchase Details
Closed on
Jan 1, 1975
Bought by
Beard William and Beard Mary B
Create a Home Valuation Report for This Property
The Home Valuation Report is an in-depth analysis detailing your home's value as well as a comparison with similar homes in the area
Home Values in the Area
Average Home Value in this Area
Purchase History
| Date | Buyer | Sale Price | Title Company |
|---|---|---|---|
| Georgene Camille Lambert Taylor Trust | $655,000 | Accommodation/Courtesy Recordi | |
| East Buildings Llc | -- | General Title Agency | |
| Mrn Limited Partnership | -- | -- | |
| M R N Company | -- | -- | |
| Sec. Of H.U.D. | -- | -- | |
| Walker Gracie | $59,000 | -- | |
| Mitchell Yvonne L | $38,000 | -- | |
| Beard William | -- | -- |
Source: Public Records
Tax History Compared to Growth
Tax History
| Year | Tax Paid | Tax Assessment Tax Assessment Total Assessment is a certain percentage of the fair market value that is determined by local assessors to be the total taxable value of land and additions on the property. | Land | Improvement |
|---|---|---|---|---|
| 2024 | $5,930 | $64,750 | $15,050 | $49,700 |
| 2023 | $3,581 | $30,800 | $11,270 | $19,530 |
| 2022 | $3,500 | $30,800 | $11,270 | $19,530 |
| 2021 | $3,490 | $30,800 | $11,270 | $19,530 |
| 2020 | $3,366 | $28,000 | $10,260 | $17,750 |
| 2019 | $3,319 | $80,000 | $29,300 | $50,700 |
| 2018 | $3,782 | $34,830 | $10,260 | $24,570 |
| 2017 | $3,575 | $28,570 | $8,860 | $19,710 |
| 2016 | $3,437 | $28,570 | $8,860 | $19,710 |
| 2015 | $3,407 | $28,570 | $8,860 | $19,710 |
| 2014 | $3,407 | $28,000 | $8,680 | $19,320 |
Source: Public Records
Map
Nearby Homes
- 3710 Strandhill Rd
- 17725 Scottsdale Blvd
- 3698 Strandhill Rd
- 18107 Scottsdale Blvd
- 18112 Lomond Blvd
- 18117 Lomond Blvd
- 17429 Scottsdale Blvd
- 3633 Ingleside Rd
- 3638 Glencairn Rd
- 3717 Gridley Rd
- 3811 E 177th St
- 3658 Normandy Rd
- 17511 Throckley Ave
- 17426 Invermere Ave
- 17422 Lomond Blvd
- 3702 Daleford Rd
- 3690 Daleford Rd
- 3656 Latimore Rd
- 17416 Throckley Ave
- 17425 Walden Ave
- 3725 Palmerston Rd
- 3717 Palmerston Rd
- 3713 Palmerston Rd
- 3709 Palmerston Rd
- 17911 Scottsdale Blvd
- 17907 Scottsdale Blvd
- 3722 Strandhill Rd
- 17921 Scottsdale Blvd
- 3718 Strandhill Rd
- 3726 Strandhill Rd
- 3705 Palmerston Rd
- 3705 Palmerston Rd Unit 3
- 3705 Palmerston Rd Unit 2
- 3714 Strandhill Rd
- 17925 Scottsdale Blvd
- 3720 Palmerston Rd
- 3726 Palmerston Rd
- 3701 Palmerston Rd Unit Lower
- 3701 Palmerston Rd
- 3701 Palmerston Rd Unit Lower Suite