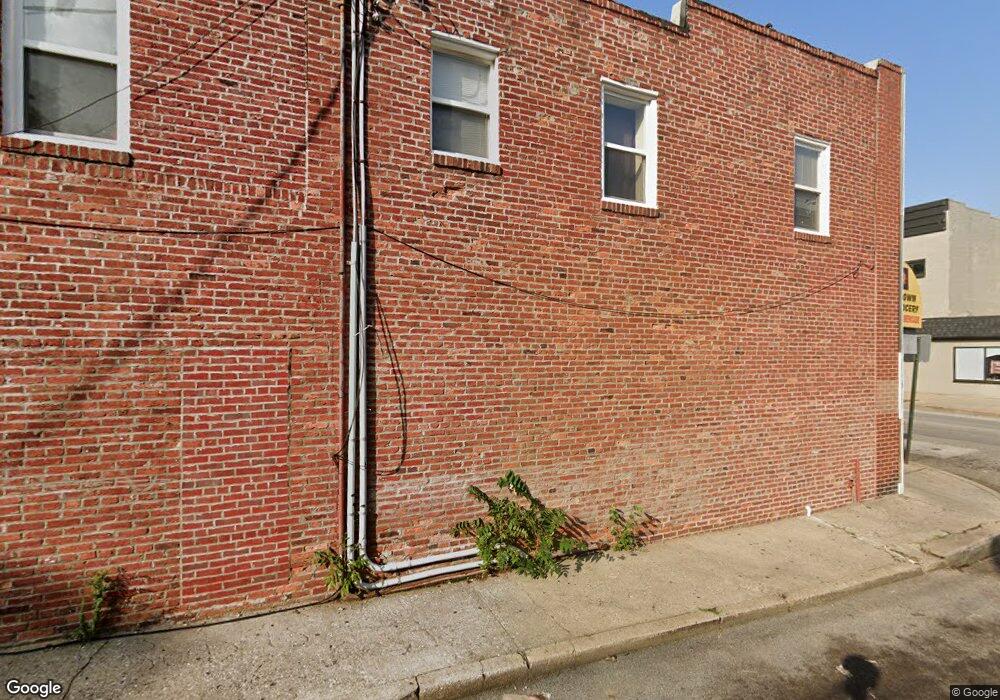
3721 S Hanover St Baltimore, MD 21225
Estimated Value: $467,015
--
Bed
--
Bath
4,500
Sq Ft
$104/Sq Ft
Est. Value
About This Home
This home is located at 3721 S Hanover St, Baltimore, MD 21225 and is currently estimated at $467,015, approximately $103 per square foot. 3721 S Hanover St is a home located in Baltimore City with nearby schools including Booker T. Washington Middle School, Benjamin Franklin High School, and Paul Laurence Dunbar High School.
Ownership History
Date
Name
Owned For
Owner Type
Purchase Details
Closed on
Aug 28, 2009
Sold by
Heppding Edward V
Bought by
3721 South Hanover Street Llc
Current Estimated Value
Home Financials for this Owner
Home Financials are based on the most recent Mortgage that was taken out on this home.
Original Mortgage
$91,000
Interest Rate
5.31%
Mortgage Type
Commercial
Purchase Details
Closed on
Apr 30, 2001
Sold by
Heppding Edward V
Bought by
Heppding Edward V
Purchase Details
Closed on
Aug 12, 1992
Sold by
Donald Donald W and Donald Wf
Bought by
Heppding Edward
Create a Home Valuation Report for This Property
The Home Valuation Report is an in-depth analysis detailing your home's value as well as a comparison with similar homes in the area
Home Values in the Area
Average Home Value in this Area
Purchase History
| Date | Buyer | Sale Price | Title Company |
|---|---|---|---|
| 3721 South Hanover Street Llc | $225,000 | -- | |
| Heppding Edward V | -- | -- | |
| Heppding Edward | $130,000 | -- |
Source: Public Records
Mortgage History
| Date | Status | Borrower | Loan Amount |
|---|---|---|---|
| Closed | 3721 South Hanover Street Llc | $91,000 |
Source: Public Records
Tax History Compared to Growth
Tax History
| Year | Tax Paid | Tax Assessment Tax Assessment Total Assessment is a certain percentage of the fair market value that is determined by local assessors to be the total taxable value of land and additions on the property. | Land | Improvement |
|---|---|---|---|---|
| 2025 | $3,032 | $134,100 | -- | -- |
| 2024 | $3,032 | $129,100 | $0 | $0 |
| 2023 | $2,929 | $124,100 | $21,000 | $103,100 |
| 2022 | $2,929 | $124,100 | $21,000 | $103,100 |
| 2021 | $2,929 | $124,100 | $21,000 | $103,100 |
| 2020 | $3,762 | $159,400 | $21,000 | $138,400 |
| 2019 | $3,620 | $154,133 | $0 | $0 |
| 2018 | $3,513 | $148,867 | $0 | $0 |
| 2017 | $3,389 | $143,600 | $0 | $0 |
| 2016 | $3,641 | $135,700 | $0 | $0 |
| 2015 | $3,641 | $127,800 | $0 | $0 |
| 2014 | $3,641 | $119,900 | $0 | $0 |
Source: Public Records
Map
Nearby Homes