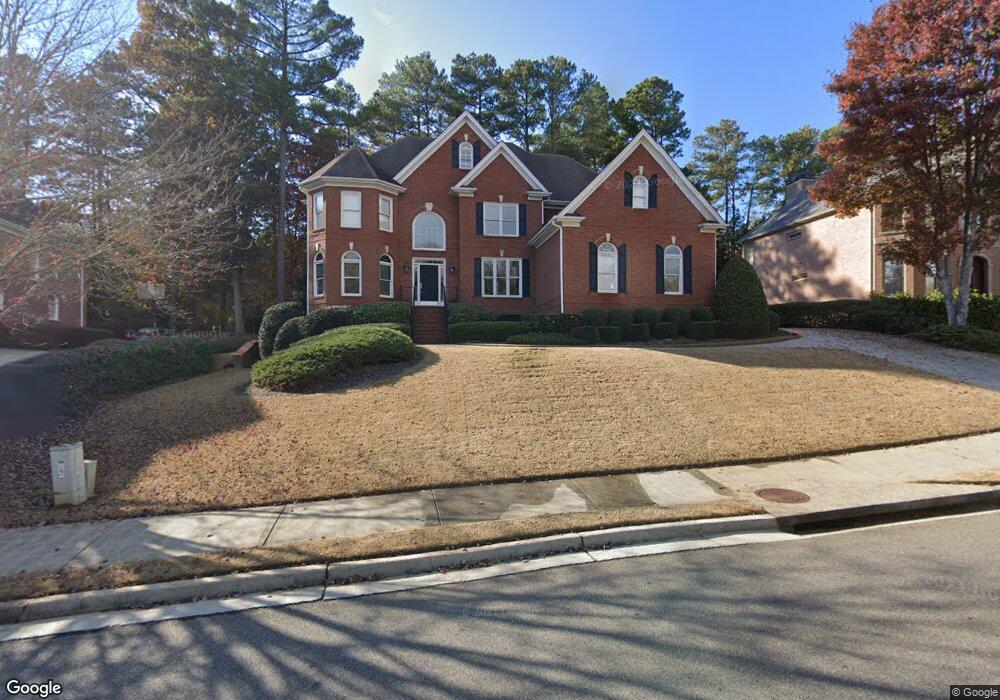
3722 Cape York Trace Unit 2 Alpharetta, GA 30022
Estimated Value: $1,117,058 - $1,357,000
5
Beds
5
Baths
3,399
Sq Ft
$361/Sq Ft
Est. Value
About This Home
This home is located at 3722 Cape York Trace Unit 2, Alpharetta, GA 30022 and is currently estimated at $1,226,765, approximately $360 per square foot. 3722 Cape York Trace Unit 2 is a home located in Fulton County with nearby schools including New Prospect Elementary School, Webb Bridge Middle School, and Alpharetta High School.
Ownership History
Date
Name
Owned For
Owner Type
Purchase Details
Closed on
May 18, 2025
Sold by
Setty Ronald R
Bought by
Setty Real Estate Llc
Current Estimated Value
Purchase Details
Closed on
Sep 26, 2013
Sold by
Thakkar Rita
Bought by
Setty Ronald R and Setty Yael M
Home Financials for this Owner
Home Financials are based on the most recent Mortgage that was taken out on this home.
Original Mortgage
$341,600
Interest Rate
3.58%
Mortgage Type
New Conventional
Purchase Details
Closed on
Aug 27, 2012
Sold by
Hill Russell
Bought by
Thakkar Rita and Parekh Dharmesh
Home Financials for this Owner
Home Financials are based on the most recent Mortgage that was taken out on this home.
Original Mortgage
$417,000
Interest Rate
3.53%
Mortgage Type
New Conventional
Purchase Details
Closed on
Nov 30, 1998
Sold by
Josh Steed Homes Llc
Bought by
Hill Russell and Hill Colleen
Home Financials for this Owner
Home Financials are based on the most recent Mortgage that was taken out on this home.
Original Mortgage
$227,150
Interest Rate
6.84%
Mortgage Type
New Conventional
Create a Home Valuation Report for This Property
The Home Valuation Report is an in-depth analysis detailing your home's value as well as a comparison with similar homes in the area
Home Values in the Area
Average Home Value in this Area
Purchase History
| Date | Buyer | Sale Price | Title Company |
|---|---|---|---|
| Setty Real Estate Llc | -- | -- | |
| Setty Ronald R | $619,000 | -- | |
| Thakkar Rita | $584,000 | -- | |
| Hill Russell | $415,700 | -- |
Source: Public Records
Mortgage History
| Date | Status | Borrower | Loan Amount |
|---|---|---|---|
| Previous Owner | Setty Ronald R | $341,600 | |
| Previous Owner | Thakkar Rita | $417,000 | |
| Previous Owner | Hill Russell | $227,150 |
Source: Public Records
Tax History Compared to Growth
Tax History
| Year | Tax Paid | Tax Assessment Tax Assessment Total Assessment is a certain percentage of the fair market value that is determined by local assessors to be the total taxable value of land and additions on the property. | Land | Improvement |
|---|---|---|---|---|
| 2025 | $1,351 | $421,680 | $125,400 | $296,280 |
| 2023 | $1,351 | $341,000 | $63,720 | $277,280 |
| 2022 | $6,016 | $278,640 | $46,800 | $231,840 |
| 2021 | $1,151 | $248,360 | $46,720 | $201,640 |
| 2020 | $7,207 | $255,400 | $35,560 | $219,840 |
| 2019 | $1,150 | $250,920 | $34,960 | $215,960 |
| 2018 | $6,245 | $245,040 | $34,120 | $210,920 |
| 2017 | $5,964 | $220,840 | $35,960 | $184,880 |
| 2016 | $5,935 | $220,840 | $35,960 | $184,880 |
| 2015 | $7,027 | $220,840 | $35,960 | $184,880 |
| 2014 | $6,296 | $205,400 | $33,440 | $171,960 |
Source: Public Records
Map
Nearby Homes
- 10900 Wittenridge Dr Unit I3
- 10900 Wittenridge Dr Unit H8
- 10900 Wittenridge Dr Unit L6
- 10845 Carrissa Trail
- 465 Kirkstall Trail
- 870 Longstone Landing
- 345 Kincardine Way Unit IIIA
- 125 Sandridge Ct
- 610 Varina Way
- 10880 Windham Way
- 825 Highland Bend Cove
- 105 Kimball Bridge Cove
- 3396 Carverton Ln
- 3010 Brooke View Ct Unit 5
- 3962 Erin Dr
- 355 Fairleaf Ct
- 4255 Park Brooke Trace
- 10530 Tuxford Dr
- 3722 Cape York Trace
- 3712 Cape York Trace Unit II
- 3732 Cape York Trace
- 135 Parkside Close
- 125 Parkside Close
- 3741 Cape York Trace
- 145 Parkside Close
- 3702 Cape York Trace Unit 235
- 3702 Cape York Trace
- 3702 Cape York Trace
- 3742 Cape York Trace
- 0 Parkside Close Unit 3239801
- 3772 Cape York Trace
- 3772 Cape York Trace
- 3731 Cape York Trace Unit 2
- 155 Parkside Close
- 3751 Cape York Trace
- 3751 Cape York Trace
- 105 Parkside Close
- 3752 Cape York Trace