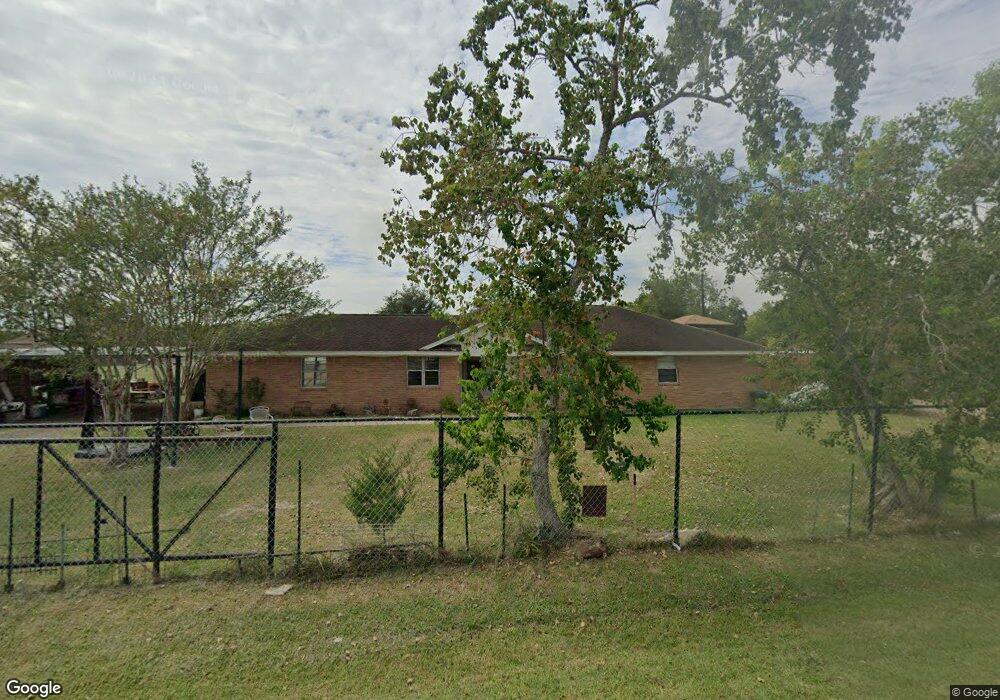
3722 Hollingsworth Dr Pearland, TX 77584
Estimated Value: $377,000 - $487,000
3
Beds
2
Baths
1,801
Sq Ft
$238/Sq Ft
Est. Value
About This Home
This home is located at 3722 Hollingsworth Dr, Pearland, TX 77584 and is currently estimated at $428,187, approximately $237 per square foot. 3722 Hollingsworth Dr is a home located in Brazoria County with nearby schools including Massey Ranch Elementary School, Pearland Junior High School South, and Sam Jamison Middle School.
Ownership History
Date
Name
Owned For
Owner Type
Purchase Details
Closed on
Sep 19, 2011
Sold by
The Bank Of New York Mellon
Bought by
Cardenas Victor V
Current Estimated Value
Purchase Details
Closed on
Oct 22, 2010
Sold by
Hernandez Jimmy and Rivera Alma
Bought by
The Bank Of New York Mellon
Purchase Details
Closed on
Dec 16, 2005
Sold by
3722 Hollingsworth Trust
Bought by
Hernandez Jimmy and Rivera Alma
Home Financials for this Owner
Home Financials are based on the most recent Mortgage that was taken out on this home.
Original Mortgage
$106,000
Interest Rate
9.87%
Mortgage Type
New Conventional
Purchase Details
Closed on
Jun 3, 2005
Sold by
Saucedo Sarah C and Saucedo Sarah Carmela
Bought by
3722 Hollingsworth Trust
Home Financials for this Owner
Home Financials are based on the most recent Mortgage that was taken out on this home.
Original Mortgage
$73,400
Interest Rate
5.79%
Mortgage Type
Purchase Money Mortgage
Create a Home Valuation Report for This Property
The Home Valuation Report is an in-depth analysis detailing your home's value as well as a comparison with similar homes in the area
Home Values in the Area
Average Home Value in this Area
Purchase History
| Date | Buyer | Sale Price | Title Company |
|---|---|---|---|
| Cardenas Victor V | -- | None Available | |
| The Bank Of New York Mellon | $84,600 | None Available | |
| Hernandez Jimmy | -- | Fidelity National Title | |
| 3722 Hollingsworth Trust | -- | -- |
Source: Public Records
Mortgage History
| Date | Status | Borrower | Loan Amount |
|---|---|---|---|
| Previous Owner | Hernandez Jimmy | $106,000 | |
| Previous Owner | 3722 Hollingsworth Trust | $73,400 |
Source: Public Records
Tax History Compared to Growth
Tax History
| Year | Tax Paid | Tax Assessment Tax Assessment Total Assessment is a certain percentage of the fair market value that is determined by local assessors to be the total taxable value of land and additions on the property. | Land | Improvement |
|---|---|---|---|---|
| 2025 | $7,102 | $405,910 | $107,520 | $298,390 |
| 2023 | $7,102 | $436,540 | $120,960 | $315,580 |
| 2022 | $4,771 | $253,820 | $77,840 | $175,980 |
| 2021 | $4,077 | $208,400 | $43,240 | $165,160 |
| 2020 | $4,333 | $210,650 | $43,240 | $167,410 |
| 2019 | $3,576 | $171,170 | $27,680 | $143,490 |
| 2018 | $3,096 | $147,280 | $27,680 | $119,600 |
| 2017 | $3,278 | $154,710 | $27,680 | $127,030 |
| 2016 | $2,973 | $140,290 | $18,450 | $121,840 |
| 2015 | $2,152 | $113,400 | $12,300 | $101,100 |
| 2014 | $2,152 | $99,290 | $12,300 | $86,990 |
Source: Public Records
Map
Nearby Homes
- 4139 County Road 101
- 0 Bailey Rd Masters Rd Unit 38179222
- 7110 W Mockingbird Ln
- 4101 Fm 1128 Rd
- 3524 Charles Ave
- 3525 Charles Ave
- 4722 Kathy Dr
- 3818 Wingtail Way
- 6618 Heron Ln
- 3902 Bluebird Way
- 3638 Manvel Rd
- 00 Bailey Rd
- 7123 Elgin St
- 4227 Old Chocolate Bayou Rd
- 6504 Patridge Dr
- 4009 Ravencrest Ct
- 3402 Windmill Palm Dr
- 17115 County Road 831
- 6406 Patridge Dr
- 3610 Kale St
- 7234 Bailey Rd
- 7230 Bailey Rd
- 3722 Rest Home Rd
- 3733 Rest Home Rd
- 0 Resthome Rd
- 3749 County Road 101b Rd
- 7218 Bailey Rd
- 3905 Bailey Ave
- 3718 Hollingsworth Dr
- 3726 Hollingsworth Dr
- 7134 Bailey Rd
- 3810 Fm 1128 Rd
- 3725 Allen Rd
- 0A Fm 1128
- 0 Bailey Cr101 Unit 33887864
- 3807 Allen Rd
- 3703 Allen Rd
- 0 Bailey Rd Masters Rd Unit 47075448
- 3811 Allen Rd Unit 101C
- 3902 Masters Rd