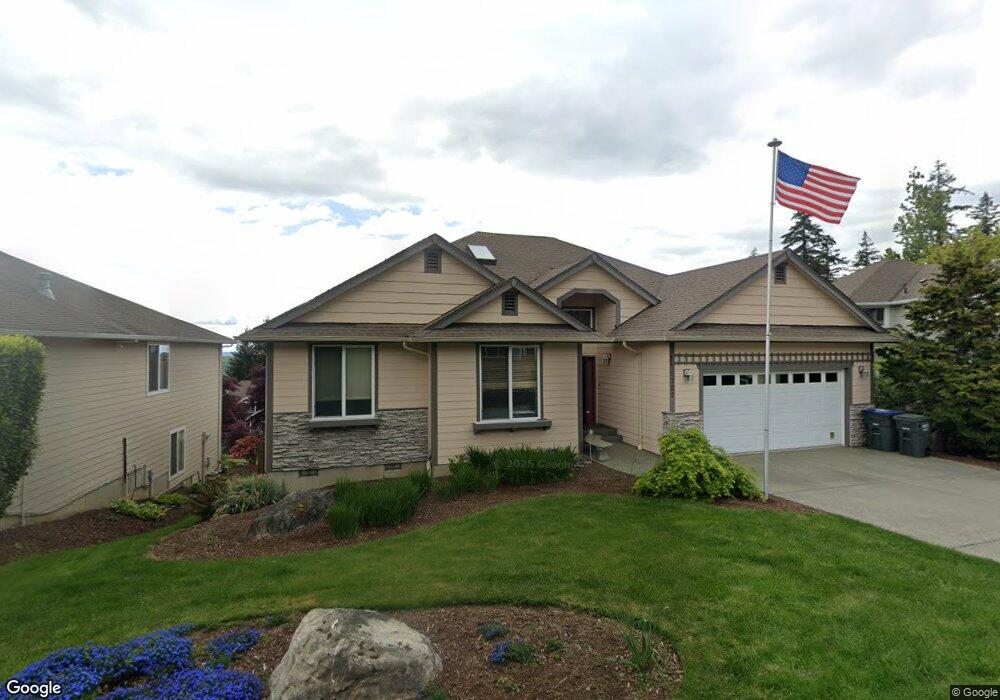
3722 Pebble Place Bellingham, WA 98226
Barkley NeighborhoodEstimated Value: $889,027 - $1,050,000
4
Beds
3
Baths
1,700
Sq Ft
$559/Sq Ft
Est. Value
About This Home
This home is located at 3722 Pebble Place, Bellingham, WA 98226 and is currently estimated at $951,007, approximately $559 per square foot. 3722 Pebble Place is a home located in Whatcom County with nearby schools including Northern Heights Elementary School, Shuksan Middle School, and Squalicum High School.
Ownership History
Date
Name
Owned For
Owner Type
Purchase Details
Closed on
Aug 8, 2017
Sold by
Needham Elizabeth Sanchez and Sanchez Elizabeth
Bought by
Needham Elizabeth Sanchez and Needham Mark
Current Estimated Value
Purchase Details
Closed on
Sep 5, 2003
Sold by
Kolar Wayne F and Kolar Sally A
Bought by
Nung Jackson and Sanchez Elizabeth
Home Financials for this Owner
Home Financials are based on the most recent Mortgage that was taken out on this home.
Original Mortgage
$288,000
Outstanding Balance
$130,194
Interest Rate
5.87%
Mortgage Type
Purchase Money Mortgage
Estimated Equity
$820,813
Purchase Details
Closed on
Jul 28, 2000
Sold by
D & L Construction Co
Bought by
Kolar Wayne F and Kolar Sally A
Home Financials for this Owner
Home Financials are based on the most recent Mortgage that was taken out on this home.
Original Mortgage
$212,000
Interest Rate
8.2%
Purchase Details
Closed on
Feb 11, 2000
Sold by
West Hills Partnership
Bought by
D & L Construction Co
Home Financials for this Owner
Home Financials are based on the most recent Mortgage that was taken out on this home.
Original Mortgage
$202,400
Interest Rate
8.06%
Create a Home Valuation Report for This Property
The Home Valuation Report is an in-depth analysis detailing your home's value as well as a comparison with similar homes in the area
Home Values in the Area
Average Home Value in this Area
Purchase History
| Date | Buyer | Sale Price | Title Company |
|---|---|---|---|
| Needham Elizabeth Sanchez | -- | Whatcom Land Title Co | |
| Nung Jackson | $360,000 | Chicago Title Insurance | |
| Kolar Wayne F | $265,000 | Charter Title Corporation | |
| D & L Construction Co | $59,000 | First American Title Ins Co |
Source: Public Records
Mortgage History
| Date | Status | Borrower | Loan Amount |
|---|---|---|---|
| Open | Nung Jackson | $288,000 | |
| Previous Owner | Kolar Wayne F | $212,000 | |
| Previous Owner | D & L Construction Co | $202,400 |
Source: Public Records
Tax History Compared to Growth
Tax History
| Year | Tax Paid | Tax Assessment Tax Assessment Total Assessment is a certain percentage of the fair market value that is determined by local assessors to be the total taxable value of land and additions on the property. | Land | Improvement |
|---|---|---|---|---|
| 2024 | $7,648 | $941,589 | $303,899 | $637,690 |
| 2023 | $7,648 | $982,992 | $317,262 | $665,730 |
| 2022 | $6,619 | $862,274 | $278,300 | $583,974 |
| 2021 | $6,231 | $712,623 | $230,000 | $482,623 |
| 2020 | $6,022 | $633,085 | $171,347 | $461,738 |
| 2019 | $5,387 | $591,451 | $160,215 | $431,236 |
| 2018 | $5,575 | $530,488 | $143,715 | $386,773 |
| 2017 | $4,848 | $469,380 | $127,160 | $342,220 |
| 2016 | $4,437 | $426,520 | $115,720 | $310,800 |
| 2015 | $4,493 | $406,423 | $110,000 | $296,423 |
| 2014 | -- | $398,237 | $103,200 | $295,037 |
| 2013 | -- | $380,920 | $100,000 | $280,920 |
Source: Public Records
Map
Nearby Homes
- 1314 Welling Rd
- 3713 Bristol St
- 3709 Bristol St
- 1379 Northwood Ct
- 3527 Sussex Dr
- 3010 E Sunset Dr
- 3606 Tree Farm Ct
- 3001 E Sunset Dr
- 1430 Welling Rd
- 1368 Roma Rd
- 3159 Chandler Pkwy
- 3715 E Sunset Dr
- 3155 Chandler Pkwy
- 3153 Chandler Pkwy
- 3785 Greenville Place
- 2809 E Sunset Dr
- 4055 Springland Ct
- 0 E Bakerview Rd Unit NWM2398341
- 3871 Cindy Ln
- 3827 Keystone Way
- 3714 Pebble Place
- 3730 Pebble Place
- 38 N Pebble Place
- 3713 Crystal Ct
- 3705 Crystal Ct
- 3723 Pebble Place
- 3715 Pebble Place
- 3731 Pebble Place
- 3721 Crystal Ct
- 3675 S Pebble Place
- 3739 Pebble Place
- 3733 Woodside Way
- 3688 S Heather Place
- 3684 S Pebble Place
- 3729 Crystal Ct
- 3742 N Heather Place
- 3734 N Heather Place
- 3667 S Pebble Place
- 3726 N Heather Place