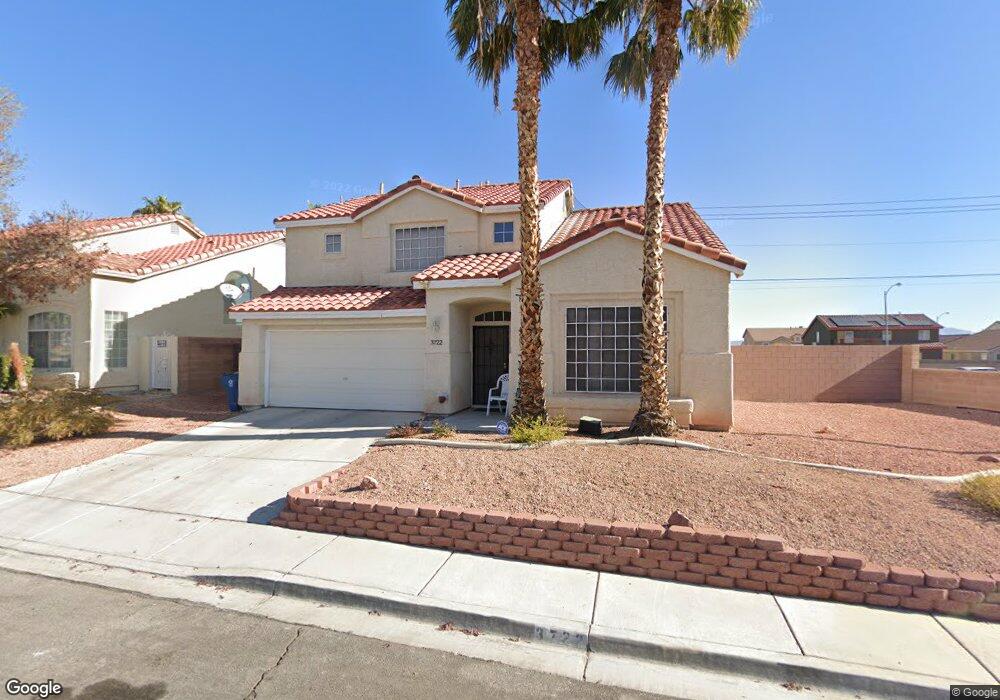
3722 Sable Palm St North Las Vegas, NV 89032
Cheyenne NeighborhoodEstimated Value: $397,000 - $448,000
4
Beds
3
Baths
1,944
Sq Ft
$214/Sq Ft
Est. Value
About This Home
This home is located at 3722 Sable Palm St, North Las Vegas, NV 89032 and is currently estimated at $416,017, approximately $214 per square foot. 3722 Sable Palm St is a home located in Clark County with nearby schools including Dr. Claude G Perkins Elementary School, Elizabeth Wilhelm Elementary School, and Marvin M Sedway Middle School.
Ownership History
Date
Name
Owned For
Owner Type
Purchase Details
Closed on
Aug 4, 2022
Sold by
Wilson Washington Sheila
Bought by
Sheila Wilson Washington Trust
Current Estimated Value
Purchase Details
Closed on
Dec 12, 2002
Sold by
Washington Raymond and Washington Shelia J
Bought by
Washington Raymond and Washington Shelia J
Home Financials for this Owner
Home Financials are based on the most recent Mortgage that was taken out on this home.
Original Mortgage
$132,278
Interest Rate
6.03%
Mortgage Type
VA
Purchase Details
Closed on
Nov 28, 1994
Sold by
Highlands Associates
Bought by
Washington Raymond and Wilson Washington Shelia J
Home Financials for this Owner
Home Financials are based on the most recent Mortgage that was taken out on this home.
Original Mortgage
$135,600
Interest Rate
8.9%
Mortgage Type
VA
Create a Home Valuation Report for This Property
The Home Valuation Report is an in-depth analysis detailing your home's value as well as a comparison with similar homes in the area
Home Values in the Area
Average Home Value in this Area
Purchase History
| Date | Buyer | Sale Price | Title Company |
|---|---|---|---|
| Sheila Wilson Washington Trust | -- | None Listed On Document | |
| Washington Raymond | -- | Pioneer National Title | |
| Washington Raymond | $133,000 | Land Title |
Source: Public Records
Mortgage History
| Date | Status | Borrower | Loan Amount |
|---|---|---|---|
| Previous Owner | Washington Raymond | $132,278 | |
| Previous Owner | Washington Raymond | $135,600 |
Source: Public Records
Tax History Compared to Growth
Tax History
| Year | Tax Paid | Tax Assessment Tax Assessment Total Assessment is a certain percentage of the fair market value that is determined by local assessors to be the total taxable value of land and additions on the property. | Land | Improvement |
|---|---|---|---|---|
| 2025 | $1,399 | $86,189 | $28,000 | $58,189 |
| 2024 | $1,359 | $86,189 | $28,000 | $58,189 |
| 2023 | $1,108 | $85,630 | $30,100 | $55,530 |
| 2022 | $1,319 | $76,102 | $25,200 | $50,902 |
| 2021 | $1,281 | $70,656 | $22,050 | $48,606 |
| 2020 | $1,241 | $70,444 | $22,050 | $48,394 |
| 2019 | $1,204 | $65,505 | $17,850 | $47,655 |
| 2018 | $1,169 | $60,394 | $14,700 | $45,694 |
| 2017 | $1,936 | $57,709 | $13,650 | $44,059 |
| 2016 | $1,108 | $46,800 | $9,100 | $37,700 |
| 2015 | $1,105 | $36,438 | $7,000 | $29,438 |
| 2014 | $1,073 | $31,435 | $7,000 | $24,435 |
Source: Public Records
Map
Nearby Homes
- 3743 Nairobi Ln
- 641 Bay Bridge Dr
- 628 Bay Bridge Dr
- 3825 Manhattan Bridge Place
- 532 Shallow Mist Ct
- 3827 Blue Gull St
- 3736 Shadow Tree St
- 1002 Christopher View Ave Unit 2
- 631 Kings Center Ave
- 1019 Felix Palm Ave
- 4116 Mattray St
- 4126 Jessica Marie St Unit 4
- 4142 Forestville St
- 320 Gray Robin Ave
- 3839 Dusty Glen Ct
- 728 Twilight Blue Ave
- 4233 Telstar Ct
- 1209 Equator Ave
- 3317 Spinet Dr
- 3644 Quail Creek Dr
- 3726 Sable Palm St
- 3730 Sable Palm St
- 3730 Sable Palm St Unit n/a
- 3730 Sable Palm St Unit sfr
- 822 Oak Island Dr
- 3714 Sable Palm St
- 823 Holly Sprig Ct
- 3734 Sable Palm St
- 738 Oak Island Dr
- 826 Oak Island Dr
- 3710 Sable Palm St
- 827 Holly Sprig Ct
- 3719 Russian Olive St
- 734 Oak Island Dr
- 729 Bay Bridge Dr Unit 2
- 3738 Sable Palm St
- 825 Oak Island Dr
- 830 Oak Island Dr
- 831 Holly Sprig Ct
- 3715 Russian Olive St