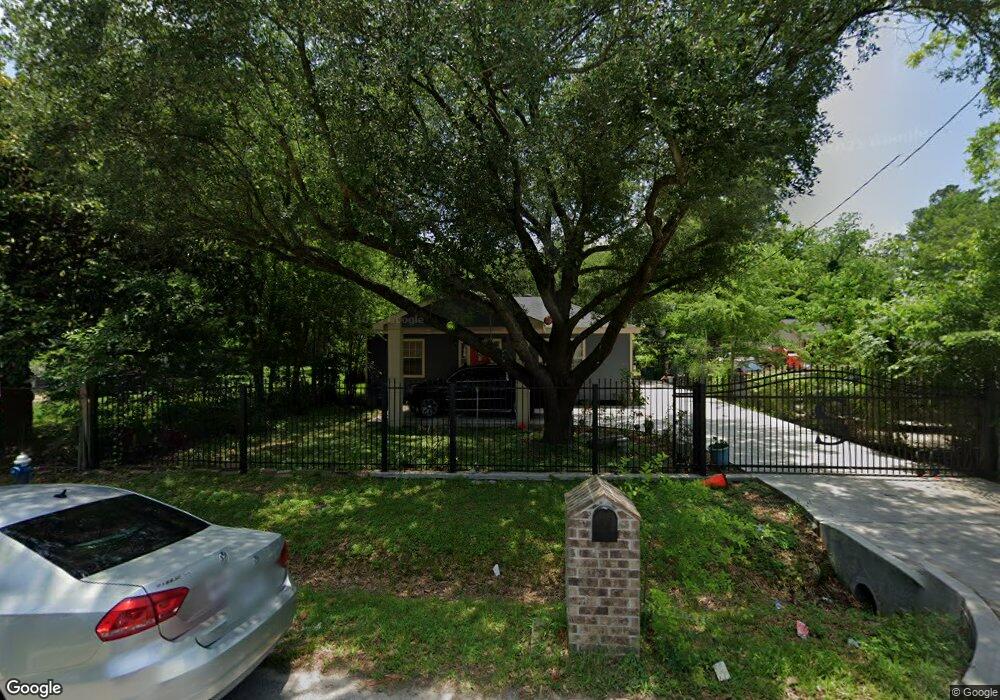
3722 Sparks St Houston, TX 77093
Eastex-Jensen NeighborhoodEstimated Value: $179,000 - $217,000
3
Beds
2
Baths
1,520
Sq Ft
$131/Sq Ft
Est. Value
About This Home
This home is located at 3722 Sparks St, Houston, TX 77093 and is currently estimated at $198,816, approximately $130 per square foot. 3722 Sparks St is a home located in Harris County with nearby schools including Roderick R. Paige Elementary School, Key Middle, and Kashmere High School.
Ownership History
Date
Name
Owned For
Owner Type
Purchase Details
Closed on
Sep 17, 2010
Sold by
U S Bank National Association
Bought by
Sanchez Javier and Garcia Gloria
Current Estimated Value
Home Financials for this Owner
Home Financials are based on the most recent Mortgage that was taken out on this home.
Original Mortgage
$71,043
Outstanding Balance
$49,368
Interest Rate
5.5%
Mortgage Type
FHA
Estimated Equity
$149,448
Purchase Details
Closed on
May 4, 2010
Sold by
Garay Jose A and Garay Maria Elida
Bought by
Us Bank National Association
Purchase Details
Closed on
Jan 4, 2007
Sold by
Barboza Carlos and Pompa Claudia M
Bought by
Garay Jose A and Garay Maria Elida
Home Financials for this Owner
Home Financials are based on the most recent Mortgage that was taken out on this home.
Original Mortgage
$74,160
Interest Rate
6.1%
Mortgage Type
Purchase Money Mortgage
Purchase Details
Closed on
Aug 17, 2000
Sold by
Bridwell Gary
Bought by
Barboza Carlos and Barboza Claudia M Pompa
Create a Home Valuation Report for This Property
The Home Valuation Report is an in-depth analysis detailing your home's value as well as a comparison with similar homes in the area
Home Values in the Area
Average Home Value in this Area
Purchase History
| Date | Buyer | Sale Price | Title Company |
|---|---|---|---|
| Sanchez Javier | -- | Etc | |
| Us Bank National Association | $72,250 | None Available | |
| Garay Jose A | -- | National Charity Title | |
| Barboza Carlos | $7,500 | -- |
Source: Public Records
Mortgage History
| Date | Status | Borrower | Loan Amount |
|---|---|---|---|
| Open | Sanchez Javier | $71,043 | |
| Previous Owner | Garay Jose A | $74,160 |
Source: Public Records
Tax History Compared to Growth
Tax History
| Year | Tax Paid | Tax Assessment Tax Assessment Total Assessment is a certain percentage of the fair market value that is determined by local assessors to be the total taxable value of land and additions on the property. | Land | Improvement |
|---|---|---|---|---|
| 2025 | $1,430 | $207,179 | $90,188 | $116,991 |
| 2024 | $1,430 | $155,500 | $55,500 | $100,000 |
| 2023 | $1,430 | $155,500 | $55,500 | $100,000 |
| 2022 | $2,495 | $121,321 | $34,688 | $86,633 |
| 2021 | $2,401 | $103,001 | $19,888 | $83,113 |
| 2020 | $2,475 | $102,194 | $19,888 | $82,306 |
| 2019 | $2,494 | $98,572 | $19,888 | $78,684 |
| 2018 | $1,704 | $98,572 | $19,888 | $78,684 |
| 2017 | $2,448 | $98,572 | $19,888 | $78,684 |
| 2016 | $2,225 | $98,572 | $19,888 | $78,684 |
| 2015 | $1,474 | $80,000 | $27,000 | $53,000 |
| 2014 | $1,474 | $80,000 | $27,000 | $53,000 |
Source: Public Records
Map
Nearby Homes
- 3809 Turner Dr
- 3806 Hage St
- 3807 Hage St
- 0.0 Friendly Rd
- 3810 Hurley St
- 3302 Sparks St
- 9217 Friendly Rd
- 4102 Kinkaid St
- 4514 Wyte Ln
- 9009 Ramin Dr
- 4525 Ireland St
- 4527 Ireland St
- 4600 Ireland St
- 4613 Ireland St Unit B
- 4622 Tidwell Rd
- 3709 Gager St
- 9343 Lavender St
- 2919 La Estancia Ln
- 4622 Firnat St
- 4506 Boicewood St