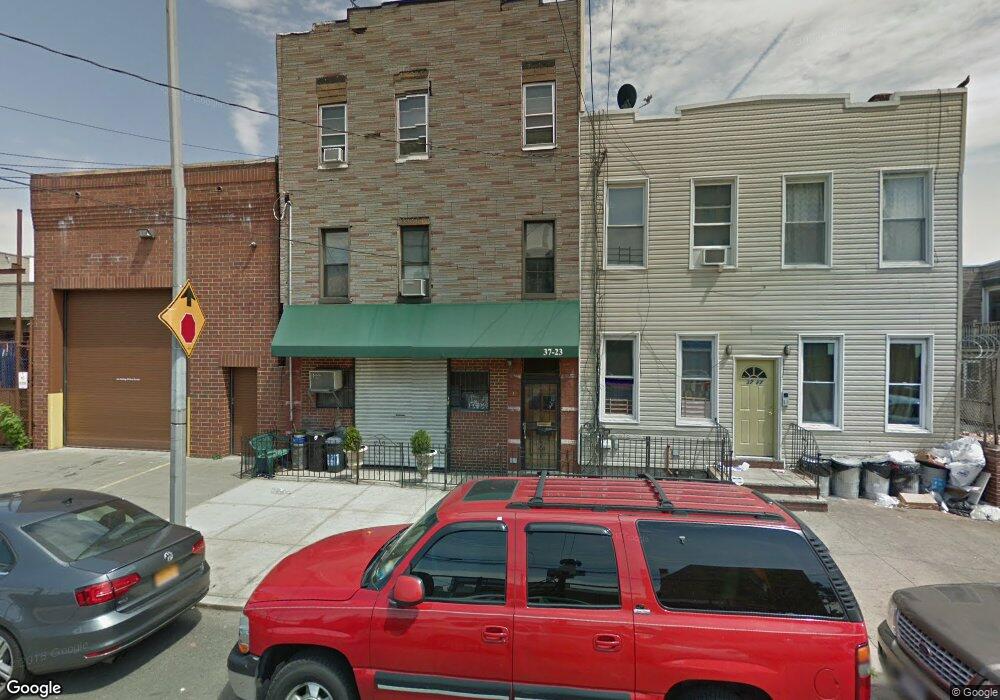
3723 11th St Long Island City, NY 11101
Long Island City NeighborhoodEstimated Value: $1,447,644
--
Bed
--
Bath
3,384
Sq Ft
$428/Sq Ft
Est. Value
About This Home
This home is located at 3723 11th St, Long Island City, NY 11101 and is currently estimated at $1,447,644, approximately $427 per square foot. 3723 11th St is a home located in Queens County with nearby schools including P.S. 111 - Jacob Blackwell, I.S. 204 Oliver W. Holmes, and Long Island City High School.
Ownership History
Date
Name
Owned For
Owner Type
Purchase Details
Closed on
Aug 27, 2019
Sold by
Botocska Gabriella and Botocska Oliver
Bought by
Hummay Properties Llc
Current Estimated Value
Home Financials for this Owner
Home Financials are based on the most recent Mortgage that was taken out on this home.
Original Mortgage
$600,000
Outstanding Balance
$526,627
Interest Rate
3.7%
Mortgage Type
Purchase Money Mortgage
Estimated Equity
$921,017
Purchase Details
Closed on
Aug 22, 2019
Sold by
Botocska Balasz and Botocska Gabriella
Bought by
Botocska Gabriella and Botocska Oliver
Home Financials for this Owner
Home Financials are based on the most recent Mortgage that was taken out on this home.
Original Mortgage
$600,000
Outstanding Balance
$526,627
Interest Rate
3.7%
Mortgage Type
Purchase Money Mortgage
Estimated Equity
$921,017
Purchase Details
Closed on
May 6, 2015
Sold by
Botocska Balazs
Bought by
Botocska Gabriella and Botocska Oliver
Create a Home Valuation Report for This Property
The Home Valuation Report is an in-depth analysis detailing your home's value as well as a comparison with similar homes in the area
Home Values in the Area
Average Home Value in this Area
Purchase History
| Date | Buyer | Sale Price | Title Company |
|---|---|---|---|
| Hummay Properties Llc | $1,265,000 | -- | |
| Botocska Gabriella | -- | -- | |
| Botocska Gabriella | -- | -- |
Source: Public Records
Mortgage History
| Date | Status | Borrower | Loan Amount |
|---|---|---|---|
| Open | Hummay Properties Llc | $600,000 | |
| Previous Owner | Botocska Gabriella | $600,000 |
Source: Public Records
Tax History Compared to Growth
Tax History
| Year | Tax Paid | Tax Assessment Tax Assessment Total Assessment is a certain percentage of the fair market value that is determined by local assessors to be the total taxable value of land and additions on the property. | Land | Improvement |
|---|---|---|---|---|
| 2025 | $10,534 | $86,962 | $30,204 | $56,758 |
| 2024 | $10,534 | $84,260 | $29,575 | $54,685 |
| 2023 | $9,754 | $78,020 | $28,882 | $49,138 |
| 2022 | $8,839 | $372,150 | $134,100 | $238,050 |
| 2021 | $8,206 | $297,900 | $134,100 | $163,800 |
| 2020 | $8,344 | $326,700 | $134,100 | $192,600 |
| 2019 | $7,528 | $297,000 | $134,100 | $162,900 |
| 2018 | $6,986 | $60,015 | $25,957 | $34,058 |
| 2017 | $6,599 | $55,571 | $26,454 | $29,117 |
| 2016 | $2,701 | $55,571 | $26,454 | $29,117 |
| 2015 | $1,718 | $51,457 | $29,546 | $21,911 |
| 2014 | $1,718 | $49,858 | $28,627 | $21,231 |
Source: Public Records
Map
Nearby Homes
- 36-26 11th St
- 36-13 10th St
- 12-07 40th Ave
- 13-09 40th Ave
- 35-30 10th St
- 38-57-59 10th St
- 34-57 9th St
- 24-09 40th Ave
- 3433 9th St
- 40-24 24th St
- 3814 27th St
- 38 ave 27th St
- 40-37 24th St
- 3411 11th St
- 40-39 24th St
- 34-21 9th St
- 37-34 28th St
- 27-09 40th Ave Unit 5A
- 27-09 40th Ave Unit 2 C
- 27-09 40th Ave Unit 3 B