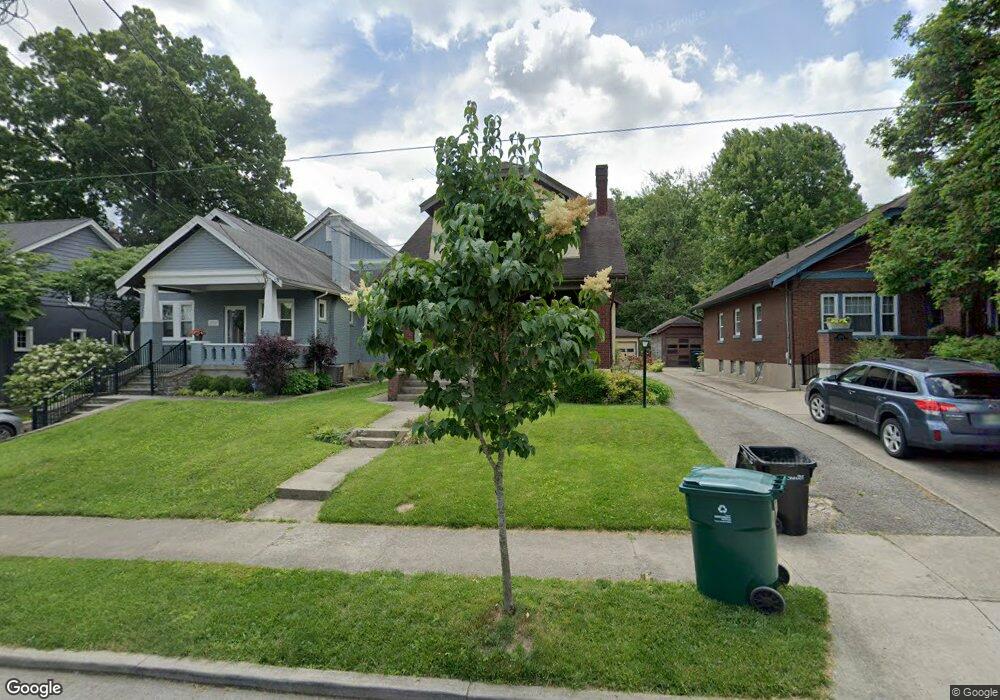
3723 Ault Park Ave Cincinnati, OH 45208
Hyde Park NeighborhoodEstimated Value: $397,486 - $472,000
3
Beds
1
Bath
1,321
Sq Ft
$323/Sq Ft
Est. Value
About This Home
This home is located at 3723 Ault Park Ave, Cincinnati, OH 45208 and is currently estimated at $427,122, approximately $323 per square foot. 3723 Ault Park Ave is a home located in Hamilton County with nearby schools including Kilgour Elementary School, Clark Montessori High School, and Shroder High School.
Ownership History
Date
Name
Owned For
Owner Type
Purchase Details
Closed on
Apr 30, 2018
Sold by
Ahlert David L and Ahlert Betsy
Bought by
Ault Park Llc
Current Estimated Value
Purchase Details
Closed on
Sep 21, 2016
Sold by
Ault Park Llc
Bought by
Ahlert David L and Ahlert Betsy
Home Financials for this Owner
Home Financials are based on the most recent Mortgage that was taken out on this home.
Original Mortgage
$142,950
Interest Rate
3.43%
Mortgage Type
New Conventional
Purchase Details
Closed on
Jan 20, 2012
Sold by
Ahlert David L and Ahlert Betsy J
Bought by
Ault Park Llc
Purchase Details
Closed on
Jul 22, 2011
Sold by
Ault Park Llc
Bought by
Ahlert David L and Ahlert Betsy J
Purchase Details
Closed on
Aug 19, 2005
Sold by
Ahlert David L and Ahlert Betsy
Bought by
Ault Park Llc
Purchase Details
Closed on
Aug 2, 2005
Sold by
Estate Of Paul L Ahlert
Bought by
Ahlert David L
Create a Home Valuation Report for This Property
The Home Valuation Report is an in-depth analysis detailing your home's value as well as a comparison with similar homes in the area
Home Values in the Area
Average Home Value in this Area
Purchase History
| Date | Buyer | Sale Price | Title Company |
|---|---|---|---|
| Ault Park Llc | -- | None Available | |
| Ahlert David L | -- | -- | |
| Ault Park Llc | -- | Attorney | |
| Ahlert David L | -- | Attorney | |
| Ault Park Llc | -- | None Available | |
| Ahlert David L | -- | None Available |
Source: Public Records
Mortgage History
| Date | Status | Borrower | Loan Amount |
|---|---|---|---|
| Previous Owner | Ahlert David L | $142,950 |
Source: Public Records
Tax History Compared to Growth
Tax History
| Year | Tax Paid | Tax Assessment Tax Assessment Total Assessment is a certain percentage of the fair market value that is determined by local assessors to be the total taxable value of land and additions on the property. | Land | Improvement |
|---|---|---|---|---|
| 2024 | $6,218 | $98,214 | $49,770 | $48,444 |
| 2023 | $6,229 | $98,214 | $49,770 | $48,444 |
| 2022 | $6,050 | $85,817 | $41,251 | $44,566 |
| 2021 | $5,947 | $85,817 | $41,251 | $44,566 |
| 2020 | $5,964 | $85,817 | $41,251 | $44,566 |
| 2019 | $5,648 | $73,980 | $35,560 | $38,420 |
| 2018 | $5,652 | $73,980 | $35,560 | $38,420 |
| 2017 | $5,444 | $73,980 | $35,560 | $38,420 |
| 2016 | $5,394 | $71,502 | $32,809 | $38,693 |
| 2015 | $4,821 | $71,502 | $32,809 | $38,693 |
| 2014 | $4,847 | $71,502 | $32,809 | $38,693 |
| 2013 | $4,524 | $65,597 | $30,100 | $35,497 |
Source: Public Records
Map
Nearby Homes
- 3744 Aylesboro Ave
- 3630 Bellecrest Ave
- 3668 Wilshire Ave
- 3646 Ashworth Dr
- 3641 Brentwood Ave
- 25 Observatory Hill
- 3713 Erie Ave
- 3529 Pembroke Ave
- 3538 Forestoak Ct
- 3460 Custer Ave
- 3474 Forestoak Ct
- 3425 Pape Ave
- 3525 Deepwoods Ln
- 19 Greenhouse Ln
- 3614 Marburg Ave
- 3458 Observatory Place
- 3508 Tarpis Ave
- 3290 Observatory Ave
- 1338 Suncrest Dr
- 1332 Herschel Ave
- 3709 Ault Park Ave
- 3727 Ault Park Ave
- 3731 Ault Park Ave
- 3705 Ault Park Ave
- 3818 Ault Park Ave
- 3735 Ault Park Ave
- 3703 Ault Park Ave
- 3716 Ault Park Ave
- 3720 Ault Park Ave
- 3714 Ault Park Ave
- 3724 Ault Park Ave
- 3743 Ault Park Ave
- 3712 Ault Park Ave
- 3734 Ault Park Ave
- 3700 Ault Park Ave
- 3701 Ault Park Ave
- 3745 Ault Park Ave
- 3740 Ault Park Ave
- 3639 Ault Park Ave
- 3747 Ault Park Ave