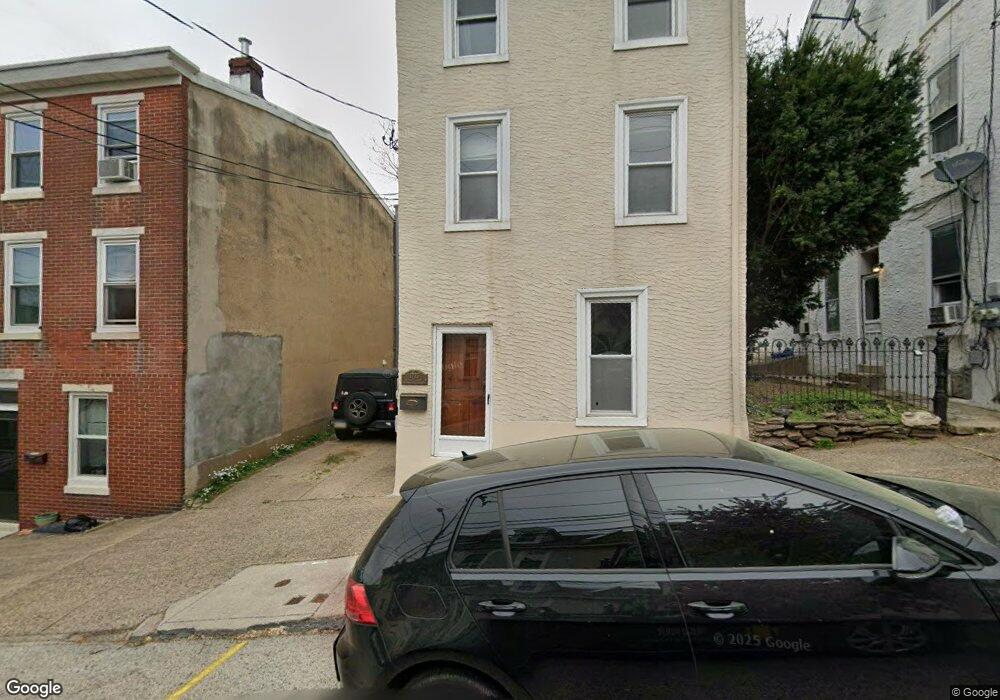
3723 Calumet St Unit 25 Philadelphia, PA 19129
East Falls NeighborhoodEstimated Value: $513,000 - $578,185
3
Beds
3
Baths
2,250
Sq Ft
$243/Sq Ft
Est. Value
About This Home
This home is located at 3723 Calumet St Unit 25, Philadelphia, PA 19129 and is currently estimated at $546,728, approximately $242 per square foot. 3723 Calumet St Unit 25 is a home located in Philadelphia County with nearby schools including Mifflin Thomas School, Roxborough High School, and Philadelphia Hebrew Public Charter School.
Ownership History
Date
Name
Owned For
Owner Type
Purchase Details
Closed on
Apr 29, 2010
Sold by
Gowdy Michael
Bought by
Mattei Jillian
Current Estimated Value
Home Financials for this Owner
Home Financials are based on the most recent Mortgage that was taken out on this home.
Original Mortgage
$266,091
Outstanding Balance
$172,080
Interest Rate
4.5%
Mortgage Type
FHA
Estimated Equity
$374,648
Purchase Details
Closed on
Nov 2, 2007
Sold by
Jacq Land Inc
Bought by
Gowdy Michael
Home Financials for this Owner
Home Financials are based on the most recent Mortgage that was taken out on this home.
Original Mortgage
$177,750
Interest Rate
6.47%
Mortgage Type
Commercial
Purchase Details
Closed on
Nov 22, 2002
Sold by
Appel Howard M and Smith Stan
Bought by
Jacq Land Inc
Home Financials for this Owner
Home Financials are based on the most recent Mortgage that was taken out on this home.
Original Mortgage
$109,600
Interest Rate
6.16%
Mortgage Type
Commercial
Create a Home Valuation Report for This Property
The Home Valuation Report is an in-depth analysis detailing your home's value as well as a comparison with similar homes in the area
Home Values in the Area
Average Home Value in this Area
Purchase History
| Date | Buyer | Sale Price | Title Company |
|---|---|---|---|
| Mattei Jillian | $271,000 | None Available | |
| Gowdy Michael | $237,000 | None Available | |
| Jacq Land Inc | $137,000 | -- |
Source: Public Records
Mortgage History
| Date | Status | Borrower | Loan Amount |
|---|---|---|---|
| Open | Mattei Jillian | $266,091 | |
| Previous Owner | Gowdy Michael | $177,750 | |
| Previous Owner | Jacq Land Inc | $109,600 |
Source: Public Records
Tax History Compared to Growth
Tax History
| Year | Tax Paid | Tax Assessment Tax Assessment Total Assessment is a certain percentage of the fair market value that is determined by local assessors to be the total taxable value of land and additions on the property. | Land | Improvement |
|---|---|---|---|---|
| 2026 | $3,618 | $505,200 | $101,040 | $404,160 |
| 2025 | $3,618 | $505,200 | $101,040 | $404,160 |
| 2024 | $3,618 | $505,200 | $101,040 | $404,160 |
| 2023 | $3,618 | $258,500 | $51,700 | $206,800 |
| 2022 | $3,653 | $258,500 | $51,700 | $206,800 |
| 2021 | $3,653 | $0 | $0 | $0 |
| 2020 | $3,653 | $0 | $0 | $0 |
| 2019 | $3,604 | $0 | $0 | $0 |
| 2018 | $3,537 | $0 | $0 | $0 |
| 2017 | $3,537 | $0 | $0 | $0 |
| 2016 | $3,537 | $0 | $0 | $0 |
| 2015 | $2,801 | $0 | $0 | $0 |
| 2014 | -- | $209,000 | $40,839 | $168,161 |
| 2012 | -- | $20,992 | $3,058 | $17,934 |
Source: Public Records
Map
Nearby Homes
- 3697 Calumet St
- 3667 Eveline St
- 3639 Fisk Ave
- 4449 River Ridge Ct
- 3637 Haywood St
- 3334 Wiehle St
- 4040 Ridge Ave
- 3542 New Queen St
- 3602 Conrad St
- 3505-07 Ainslie St
- 3464 Tilden St
- 3464 Division St
- 3430 Warden Dr
- 2422 Ridge Ave
- 1549 & 1551 Ridge Ave
- 3443 Midvale Ave
- 3411 Ainslie St
- 3424 Sunnyside Ave
- 3420 W Coulter St
- 4000 Gypsy Ln Unit 637
- 3723-25 Calumet St
- 3727 Calumet St
- 3729 Calumet St
- 3719 Calumet St Unit 3
- 3719 Calumet St Unit 21
- 3719 Calumet St Unit 1
- 3719 Calumet St Unit 2
- 3715 Calumet St Unit 1
- 3715 Calumet St Unit 3
- 3735 Calumet St
- 3713 Calumet St
- 3737 Calumet St
- 3711 Calumet St
- 3739 Calumet St
- 3718 Calumet St
- 3707 Calumet St
- 3708 Calumet St
- 3710 Calumet St
- 3716 Calumet St