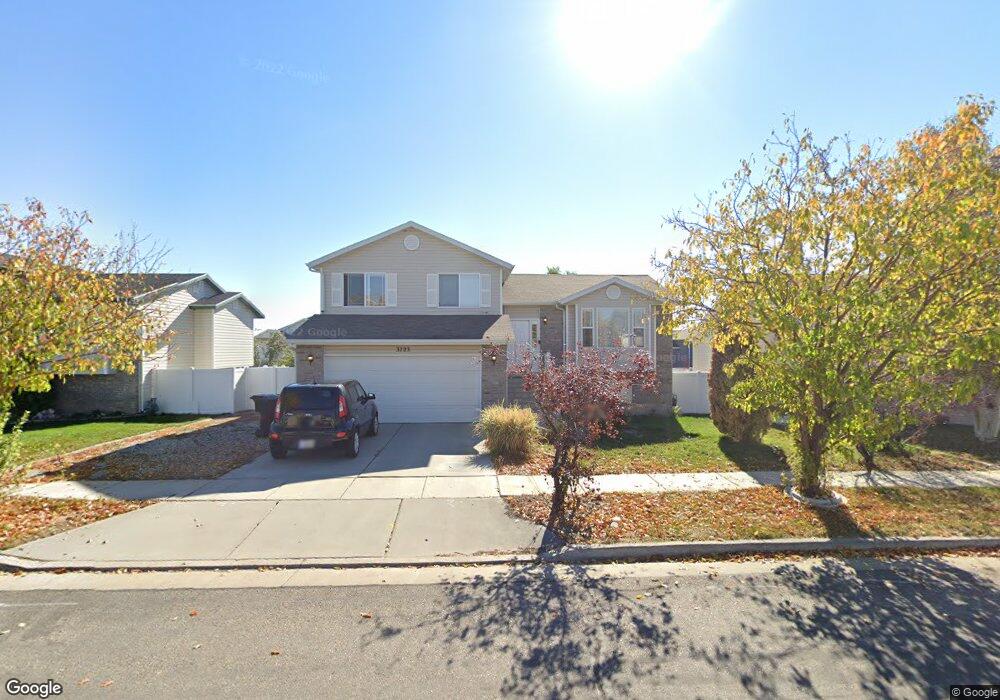
3723 W 850 S Syracuse, UT 84075
Estimated Value: $468,000 - $536,000
4
Beds
3
Baths
2,000
Sq Ft
$247/Sq Ft
Est. Value
About This Home
This home is located at 3723 W 850 S, Syracuse, UT 84075 and is currently estimated at $494,712, approximately $247 per square foot. 3723 W 850 S is a home located in Davis County with nearby schools including West Point School, West Point Junior High School, and Syracuse High School.
Ownership History
Date
Name
Owned For
Owner Type
Purchase Details
Closed on
Oct 9, 2018
Sold by
Gomez Reyes A and Gomez Maria Guadalupe Jaimes De
Bought by
Ah4r Properties Two Llc
Current Estimated Value
Purchase Details
Closed on
Nov 7, 2006
Sold by
Veldhuizen Ryan D and Veldhuizen Deborah M
Bought by
Gomez Reyes A and Gomez Maria Guadalaupe
Home Financials for this Owner
Home Financials are based on the most recent Mortgage that was taken out on this home.
Original Mortgage
$143,920
Interest Rate
6.3%
Mortgage Type
Purchase Money Mortgage
Purchase Details
Closed on
Nov 25, 2003
Sold by
Mark Higley Construction Lc
Bought by
Veldhuizen Ryan D and Veldhuizen Deborah M
Home Financials for this Owner
Home Financials are based on the most recent Mortgage that was taken out on this home.
Original Mortgage
$135,558
Interest Rate
6%
Mortgage Type
VA
Create a Home Valuation Report for This Property
The Home Valuation Report is an in-depth analysis detailing your home's value as well as a comparison with similar homes in the area
Home Values in the Area
Average Home Value in this Area
Purchase History
| Date | Buyer | Sale Price | Title Company |
|---|---|---|---|
| Ah4r Properties Two Llc | -- | Hickman Land Title Co | |
| Gomez Reyes A | -- | Backman Title Services | |
| Veldhuizen Ryan D | -- | Heritage West Title Ins |
Source: Public Records
Mortgage History
| Date | Status | Borrower | Loan Amount |
|---|---|---|---|
| Previous Owner | Gomez Reyes A | $143,920 | |
| Previous Owner | Veldhuizen Ryan D | $135,558 |
Source: Public Records
Tax History Compared to Growth
Tax History
| Year | Tax Paid | Tax Assessment Tax Assessment Total Assessment is a certain percentage of the fair market value that is determined by local assessors to be the total taxable value of land and additions on the property. | Land | Improvement |
|---|---|---|---|---|
| 2025 | $2,434 | $234,850 | $99,540 | $135,310 |
| 2024 | $2,378 | $230,999 | $72,999 | $158,000 |
| 2023 | $2,305 | $224,400 | $65,131 | $159,269 |
| 2022 | $2,483 | $438,000 | $101,097 | $336,903 |
| 2021 | $2,237 | $336,000 | $81,514 | $254,486 |
| 2020 | $1,994 | $290,000 | $61,870 | $228,130 |
| 2019 | $1,923 | $276,000 | $67,652 | $208,348 |
| 2018 | $1,628 | $232,000 | $67,106 | $164,894 |
| 2016 | $1,375 | $102,740 | $30,017 | $72,723 |
| 2015 | $1,304 | $92,840 | $30,017 | $62,823 |
| 2014 | $1,265 | $91,773 | $30,017 | $61,756 |
| 2013 | -- | $93,594 | $28,218 | $65,376 |
Source: Public Records
Map
Nearby Homes
- 3661 W 800 S
- 3649 W 800 S
- 3565 W 800 S
- 851 S 3525 W
- 3736 W 1225 S
- 3951 Baltimore Cir
- 3867 Rungsted Cir
- 3627 W Augusta Dr
- 835 S Criddle Rd
- 1084 S 4090 W
- 4105 W 550 S
- 1039 S 4250 W
- 3882 Turnberry Dr
- 3564 Princeville Dr
- 4244 W 625 S
- 1441 Brookshire Dr
- 1238 S 4290 W
- 4443 W 920 S Unit 110
- 1157 S 4425 W
- 4191 W 1425 S