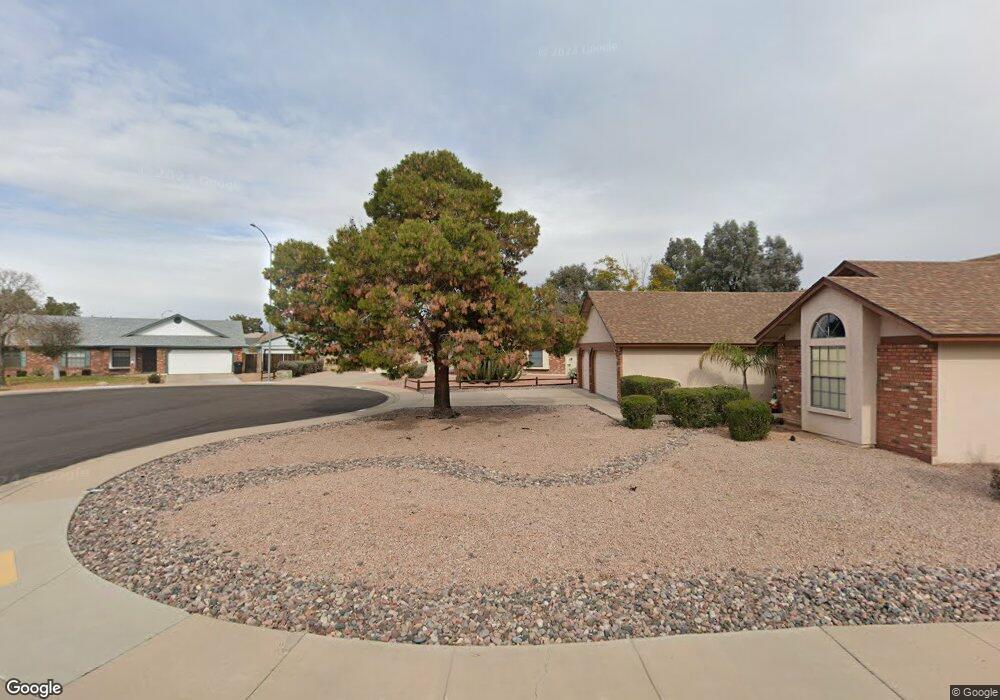
3724 E Dragoon Ave Mesa, AZ 85206
Central Mesa NeighborhoodEstimated Value: $492,565 - $538,000
Studio
3
Baths
1,856
Sq Ft
$278/Sq Ft
Est. Value
About This Home
This home is located at 3724 E Dragoon Ave, Mesa, AZ 85206 and is currently estimated at $515,891, approximately $277 per square foot. 3724 E Dragoon Ave is a home located in Maricopa County with nearby schools including Johnson Elementary School, Franklin at Brimhall Elementary School, and Franklin West Elementary School.
Ownership History
Date
Name
Owned For
Owner Type
Purchase Details
Closed on
Feb 23, 2005
Sold by
Olson Kevin L
Bought by
Olson Kevin L and Olson Cathy
Current Estimated Value
Home Financials for this Owner
Home Financials are based on the most recent Mortgage that was taken out on this home.
Original Mortgage
$165,600
Outstanding Balance
$84,177
Interest Rate
5.65%
Mortgage Type
New Conventional
Estimated Equity
$431,714
Purchase Details
Closed on
Feb 3, 1999
Sold by
Olson Donna J Hudson
Bought by
Olson Kevin L
Purchase Details
Closed on
Feb 18, 1997
Sold by
Cornell David A and Cornell Christine F
Bought by
Olson Kevin L and Hudson Olson Donna J
Home Financials for this Owner
Home Financials are based on the most recent Mortgage that was taken out on this home.
Original Mortgage
$162,225
Interest Rate
7.86%
Mortgage Type
VA
Create a Home Valuation Report for This Property
The Home Valuation Report is an in-depth analysis detailing your home's value as well as a comparison with similar homes in the area
Home Values in the Area
Average Home Value in this Area
Purchase History
| Date | Buyer | Sale Price | Title Company |
|---|---|---|---|
| Olson Kevin L | -- | -- | |
| Olson Kevin L | -- | Ticor Title Agency Of Az Inc | |
| Olson Kevin L | -- | -- | |
| Olson Kevin L | $157,500 | Capital Title Agency |
Source: Public Records
Mortgage History
| Date | Status | Borrower | Loan Amount |
|---|---|---|---|
| Open | Olson Kevin L | $165,600 | |
| Previous Owner | Olson Kevin L | $162,225 |
Source: Public Records
Tax History
| Year | Tax Paid | Tax Assessment Tax Assessment Total Assessment is a certain percentage of the fair market value that is determined by local assessors to be the total taxable value of land and additions on the property. | Land | Improvement |
|---|---|---|---|---|
| 2025 | $2,036 | $24,514 | -- | -- |
| 2024 | $2,058 | $23,347 | -- | -- |
| 2023 | $2,058 | $39,330 | $7,860 | $31,470 |
| 2022 | $2,013 | $31,700 | $6,340 | $25,360 |
| 2021 | $2,068 | $29,280 | $5,850 | $23,430 |
| 2020 | $2,040 | $27,750 | $5,550 | $22,200 |
| 2019 | $1,890 | $25,830 | $5,160 | $20,670 |
| 2018 | $1,805 | $23,910 | $4,780 | $19,130 |
| 2017 | $1,748 | $21,520 | $4,300 | $17,220 |
| 2016 | $1,716 | $21,870 | $4,370 | $17,500 |
| 2015 | $1,621 | $20,530 | $4,100 | $16,430 |
Source: Public Records
Map
Nearby Homes
- 3755 E Broadway Rd Unit 96
- 441 S Maple Unit 95
- 441 S Maple Unit 8
- 3544 E Diamond Ave
- 305 S Val Vista Dr Unit 78
- 305 S Val Vista Dr Unit 193
- 305 S Val Vista Dr Unit 436
- 305 S Val Vista Dr Unit 280
- 305 S Val Vista Dr Unit 71
- 305 S Val Vista Dr Unit 94
- 305 S Val Vista Dr Unit 188
- 305 S Val Vista Dr Unit 207
- 305 S Val Vista Dr Unit 49
- 305 S Val Vista Dr Unit 328
- 305 S Val Vista Dr Unit 315
- 305 S Val Vista Dr Unit 376
- 305 S Val Vista Dr Unit 408
- 305 S Val Vista Dr Unit 424
- 305 S Val Vista Dr Unit 248
- 305 S Val Vista Dr Unit 234
- 3728 E Dragoon Ave
- 3729 E Clovis Ave
- 3725 E Clovis Ave
- 3735 E Clovis Ave
- 3750 E Dragoon Ave
- 3720 E Dragoon Ave
- 3723 E Clovis Ave
- 3746 E Dragoon Ave
- 3793 E Clovis Ave
- 3716 E Dragoon Ave
- 3717 E Clovis Ave
- 3743 E Clovis Ave
- 3735 E Dragoon Ave
- 3723 E Dragoon Ave
- 10347 S Dragoon Ave
- 3732 E Clovis Ave
- 3743 E Dragoon Ave
- 3754 E Dragoon Ave
- 3726 E Clovis Ave
- 3717 E Dragoon Ave
Your Personal Tour Guide
Ask me questions while you tour the home.