
Seller's Agent in 2020
Laura Gillott
KELLER WILLIAMS REALTY MID-WILLAMETTE - GILLOTT TEAM
(541) 451-2211
2 in this area
1,716 Total Sales


Estimated Value: $432,000 - $461,000
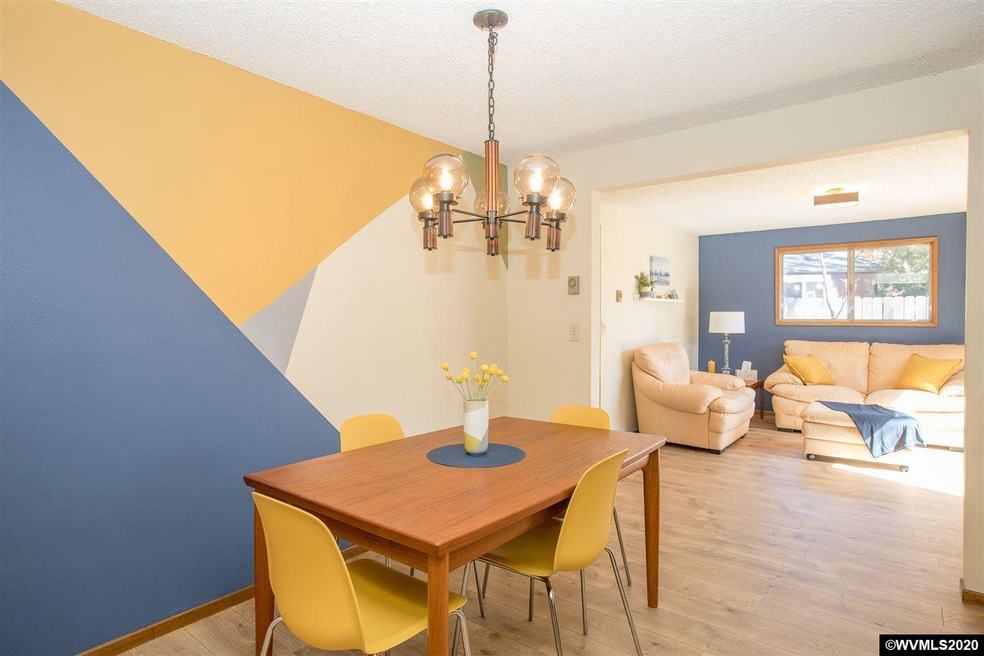
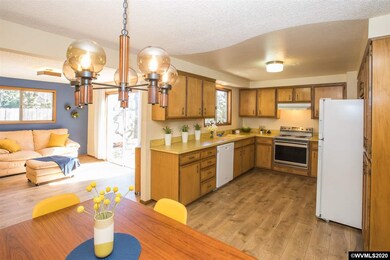
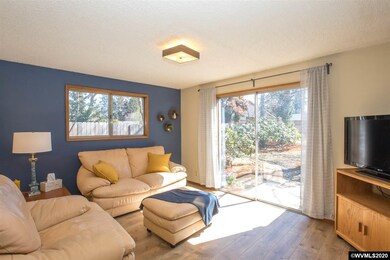
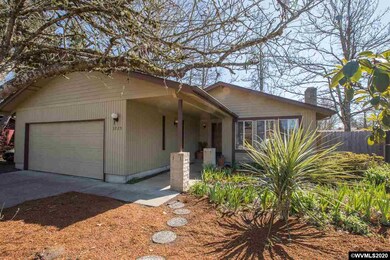
Ferry Street Bridge single level 3 bed 2 bath well cared for Home. Sunken living room with wood burning fireplace. Family room with slider to patio and fenced back yard. New wide plank laminate in Hall, Kitchen/Dining & family. New carpet in two Bedrooms.
Last Agent to Sell the Property
KELLER WILLIAMS REALTY MID-WILLAMETTE - GILLOTT TEAM License #920300248 Listed on: 03/20/2020
Co-Listed By
GERRIE DEAN
KELLER WILLIAMS REALTY MID-WILLAMETTE - GILLOTT TEAM License #941000053
| Date | Buyer | Sale Price | Title Company |
|---|---|---|---|
| Duong Nguyen Huu Nam | $328,000 | Cascade Title Co | |
| Jann Benjamin J | -- | None Available |
| Date | Status | Borrower | Loan Amount |
|---|---|---|---|
| Open | Duong Nguyen Huu Nam | $262,400 |
| Date | Event | Price | List to Sale | Price per Sq Ft |
|---|---|---|---|---|
| 05/01/2020 05/01/20 | Sold | $328,000 | -0.6% | $244 / Sq Ft |
| 03/20/2020 03/20/20 | For Sale | $330,000 | -- | $246 / Sq Ft |
| Year | Tax Paid | Tax Assessment Tax Assessment Total Assessment is a certain percentage of the fair market value that is determined by local assessors to be the total taxable value of land and additions on the property. | Land | Improvement |
|---|---|---|---|---|
| 2025 | $4,266 | $218,927 | -- | -- |
| 2024 | $4,212 | $212,551 | -- | -- |
| 2023 | $4,212 | $206,361 | $0 | $0 |
| 2022 | $3,946 | $200,351 | $0 | $0 |
| 2021 | $3,707 | $194,516 | $0 | $0 |
| 2020 | $3,720 | $188,851 | $0 | $0 |
| 2019 | $3,592 | $183,351 | $0 | $0 |
| 2018 | $3,382 | $172,826 | $0 | $0 |
| 2017 | $3,230 | $172,826 | $0 | $0 |
| 2016 | $3,146 | $167,792 | $0 | $0 |
| 2015 | $3,007 | $162,905 | $0 | $0 |
| 2014 | $2,905 | $158,160 | $0 | $0 |
Seller's Agent in 2020
Laura Gillott
KELLER WILLIAMS REALTY MID-WILLAMETTE - GILLOTT TEAM
(541) 451-2211
2 in this area
1,716 Total Sales
G
Seller Co-Listing Agent in 2020
GERRIE DEAN
KELLER WILLIAMS REALTY MID-WILLAMETTE - GILLOTT TEAM
Source: Willamette Valley MLS
MLS Number: 761563
APN: 1150281
Disclaimer: Certain information contained herein is derived from information provided by parties other than Homes.com. All information provided is deemed reliable, but is not guaranteed to be accurate and should be independently verified.
![]() Based on information from Willamette Valley Multiple Listing Service, which neither guarantees nor is in any way responsible for its accuracy. All data is provided ‘AS IS’ and with all faults. Data maintained by Willamette Valley Multiple Listing Service may not reflect all real estate activity in the market. WVMLS Member Broker: Arlene Richardson
Based on information from Willamette Valley Multiple Listing Service, which neither guarantees nor is in any way responsible for its accuracy. All data is provided ‘AS IS’ and with all faults. Data maintained by Willamette Valley Multiple Listing Service may not reflect all real estate activity in the market. WVMLS Member Broker: Arlene Richardson
Ask me questions while you tour the home.