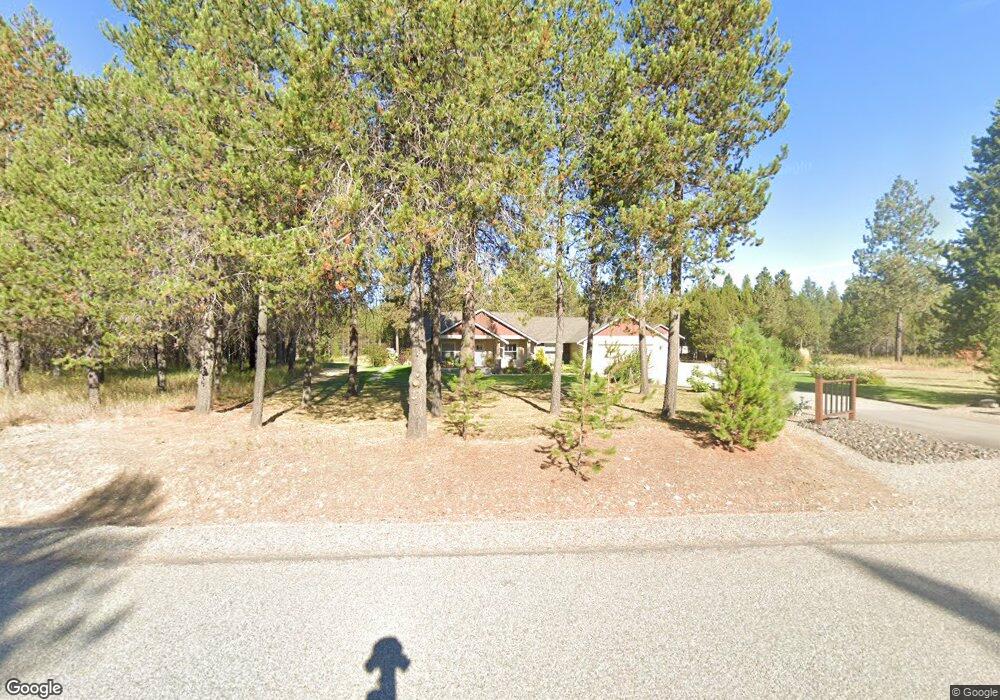
3725 W Flatwoods Loop Rathdrum, ID 83858
Estimated Value: $904,000 - $1,048,000
3
Beds
3
Baths
1,891
Sq Ft
$523/Sq Ft
Est. Value
About This Home
This home is located at 3725 W Flatwoods Loop, Rathdrum, ID 83858 and is currently estimated at $989,522, approximately $523 per square foot. 3725 W Flatwoods Loop is a home located in Kootenai County with nearby schools including Garwood Elementary School, Lakeland Middle School, and Lakeland Senior High School.
Ownership History
Date
Name
Owned For
Owner Type
Purchase Details
Closed on
Jun 5, 2023
Sold by
Tasche Robert J
Bought by
Tasche Family Trust
Current Estimated Value
Purchase Details
Closed on
Dec 6, 2017
Sold by
Johnson Luke J and Johnson Jessie
Bought by
Farmanian Gregory and Farmanian Debra I
Home Financials for this Owner
Home Financials are based on the most recent Mortgage that was taken out on this home.
Original Mortgage
$250,000
Interest Rate
3.94%
Mortgage Type
Future Advance Clause Open End Mortgage
Purchase Details
Closed on
Sep 27, 2016
Sold by
Christopherson Richard and Christopherson Deborah
Bought by
Tasche Robert J and Tasche Vicki R
Purchase Details
Closed on
Jan 10, 2013
Sold by
Sylte Development Llc
Bought by
Christopherson Richard and Christopherson Deborah
Create a Home Valuation Report for This Property
The Home Valuation Report is an in-depth analysis detailing your home's value as well as a comparison with similar homes in the area
Home Values in the Area
Average Home Value in this Area
Purchase History
| Date | Buyer | Sale Price | Title Company |
|---|---|---|---|
| Tasche Family Trust | -- | None Listed On Document | |
| Farmanian Gregory | -- | Kootenai Title | |
| Tasche Robert J | -- | Pioneer Title Kootenai Count | |
| Christopherson Richard | -- | Kootenai County Title Compan |
Source: Public Records
Mortgage History
| Date | Status | Borrower | Loan Amount |
|---|---|---|---|
| Previous Owner | Farmanian Gregory | $250,000 |
Source: Public Records
Tax History
| Year | Tax Paid | Tax Assessment Tax Assessment Total Assessment is a certain percentage of the fair market value that is determined by local assessors to be the total taxable value of land and additions on the property. | Land | Improvement |
|---|---|---|---|---|
| 2025 | $2,679 | $931,928 | $421,698 | $510,230 |
| 2024 | $2,840 | $924,790 | $420,580 | $504,210 |
| 2023 | $2,840 | $943,540 | $439,330 | $504,210 |
| 2022 | $3,307 | $941,574 | $437,364 | $504,210 |
| 2021 | $3,473 | $624,826 | $257,126 | $367,700 |
| 2020 | $3,570 | $542,174 | $212,404 | $329,770 |
| 2019 | $3,798 | $508,955 | $205,855 | $303,100 |
| 2018 | $3,859 | $465,320 | $187,140 | $278,180 |
| 2017 | $4,877 | $427,092 | $161,992 | $265,100 |
| 2016 | $2,829 | $353,787 | $140,447 | $213,340 |
| 2015 | $2,350 | $290,160 | $90,000 | $200,160 |
| 2013 | $444 | $74,867 | $74,867 | $0 |
Source: Public Records
Map
Nearby Homes
- 16649 N Sitka Rd
- 16155 N Mountain View Rd
- L7 B1 N Mountain View Rd
- L9 B1 N Mountain View Rd
- 3093 W Highway 53 Unit 20
- L14 B1 N Mountain View Rd
- L8 B1 N Mountain View Rd
- L3 B1 N Mountain View Rd
- L15 B1 N Mountain View Rd
- 4725 W Highway 53
- L11 B1 N Mountain View Rd
- 4882 W Highway 53
- 15707 N Ranch Valley Rd
- L4B1 N Mountain View Rd
- NKA W Sturgeon Rd Lot 4
- 5725 W Highway 53 Unit Q
- 16037 N Hadley Loop
- 6161 Pelican Loop
- 6143 Pelican Loop
- 6139 Pelican Loop
- 0 Stormking Dr L4 B1
- 4133 W Flatwoods Loop
- 0 Flatwoods Loop Lt 7 Bk 1
- 3710 W Flatwoods Loop
- 3521 W Flatwoods Loop
- 3630 W Flatwoods Loop
- 3800 W Flatwoods Loop
- NNA Flatwood
- 3878 W Flatwoods Loop
- 4072 W Flatwoods Loop
- 3840 W Flatwoods Loop
- 4002 W Flatwoods Loop
- 4257 W Flatwoods Loop
- 3946 W Flatwoods Loop
- A15 Stormking Dr
- A28 Stormking Dr
- A26 Stormking Dr
- A25 Stormking Dr
- NKA Flatwoods L1 B1
- NKA Flatwoods
Your Personal Tour Guide
Ask me questions while you tour the home.