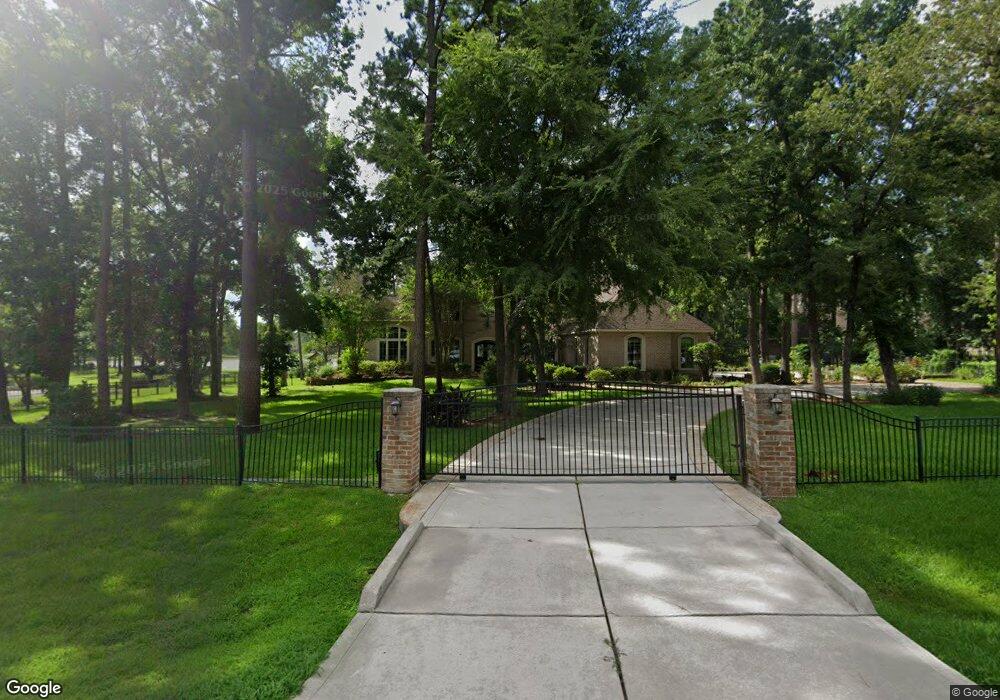
3726 W Benders Landing Blvd Spring, TX 77386
Benders Landing NeighborhoodEstimated Value: $1,341,000 - $1,466,000
4
Beds
6
Baths
5,011
Sq Ft
$276/Sq Ft
Est. Value
About This Home
This home is located at 3726 W Benders Landing Blvd, Spring, TX 77386 and is currently estimated at $1,381,940, approximately $275 per square foot. 3726 W Benders Landing Blvd is a home located in Montgomery County with nearby schools including Snyder Elementary School, York J High School, and Grand Oaks High School.
Ownership History
Date
Name
Owned For
Owner Type
Purchase Details
Closed on
Aug 25, 2016
Sold by
Wood Bradford R and Wood Yamelis
Bought by
Patro Sanjukta Esety and Sanders Michael
Current Estimated Value
Home Financials for this Owner
Home Financials are based on the most recent Mortgage that was taken out on this home.
Original Mortgage
$500,000
Outstanding Balance
$385,223
Interest Rate
2.37%
Mortgage Type
Adjustable Rate Mortgage/ARM
Estimated Equity
$996,717
Purchase Details
Closed on
Apr 17, 2013
Sold by
Lgi Land Ltd
Bought by
Wood Bradford R
Home Financials for this Owner
Home Financials are based on the most recent Mortgage that was taken out on this home.
Original Mortgage
$143,000
Interest Rate
3.55%
Mortgage Type
Stand Alone Second
Purchase Details
Closed on
Apr 12, 2005
Sold by
Morris Homes Ltd
Bought by
Lgi Land Ltd
Create a Home Valuation Report for This Property
The Home Valuation Report is an in-depth analysis detailing your home's value as well as a comparison with similar homes in the area
Home Values in the Area
Average Home Value in this Area
Purchase History
| Date | Buyer | Sale Price | Title Company |
|---|---|---|---|
| Patro Sanjukta Esety | -- | Texas American Title Company | |
| Wood Bradford R | -- | Texas American Title Company | |
| Lgi Land Ltd | -- | -- |
Source: Public Records
Mortgage History
| Date | Status | Borrower | Loan Amount |
|---|---|---|---|
| Open | Patro Sanjukta Esety | $500,000 | |
| Previous Owner | Wood Bradford R | $143,000 |
Source: Public Records
Tax History Compared to Growth
Tax History
| Year | Tax Paid | Tax Assessment Tax Assessment Total Assessment is a certain percentage of the fair market value that is determined by local assessors to be the total taxable value of land and additions on the property. | Land | Improvement |
|---|---|---|---|---|
| 2025 | $17,557 | $1,305,000 | $477,419 | $827,581 |
| 2024 | $15,848 | $1,254,000 | -- | -- |
| 2023 | $15,848 | $1,146,070 | $330,520 | $951,600 |
| 2022 | $18,078 | $1,041,880 | $299,750 | $897,330 |
| 2021 | $17,510 | $947,160 | $188,520 | $811,480 |
| 2020 | $16,741 | $861,050 | $188,520 | $672,530 |
| 2019 | $17,345 | $861,050 | $180,000 | $681,050 |
| 2018 | $17,148 | $920,310 | $180,000 | $740,310 |
| 2017 | $18,010 | $895,310 | $180,000 | $715,310 |
| 2016 | $16,527 | $821,590 | $180,000 | $642,960 |
| 2015 | $13,559 | $746,900 | $180,000 | $698,860 |
| 2014 | $13,559 | $679,000 | $168,000 | $511,000 |
Source: Public Records
Map
Nearby Homes
- 28610 Pinnacle Point Place
- 3240 Raintree Crescent Trail
- 28618 Benders Crossing Dr
- 3807 Jewel Point Dr
- 3630 Garrison Run Dr
- 3707 Lake Bend Shore Dr
- 3602 Avalon Castle Dr
- 3622 Bluebonnet Trace Dr
- 3791 Lake Bend Shore Dr
- 3010 Lockeridge Village Dr
- 29650 Yaupon Shore Dr
- 3702 Deerbend Ct
- 4030 Steep Woods Dr
- 28547 Lockeridge Springs Dr
- 29627 Yaupon Shore Dr
- 28654 Clear Woods Dr
- 1803 Riley Fuzzel Rd
- 4065 Windsor Chase Dr
- 3610 Rock Daisy Dr
- 4022 Sabine Valley Trail
- 3722 W Benders Landing Blvd
- 3718 W Benders Landing Blvd
- 28602 Benderwood Ct
- 3802 W Benders Landing Blvd
- 3684 Oakmist Bend Ln
- 28603 Benderwood Ct
- 28602 Benders Crossing Dr
- 3714 W Benders Landing Blvd
- 3806 W Benders Landing Blvd
- bk1lot1 Benderwood Ct
- 28603 Pinnacle Point Place
- 28606 Benderwood Ct
- 3810 W Benders Landing Blvd
- 3710 W Benders Landing Blvd
- 28610 Benderwood Ct
- 28607 Pinnacle Point Place
- 28615 Benderwood Ct
- 28611 Benderwood Ct
- 28602 Pinnacle Point Place
- 28610 Benders Crossing Dr