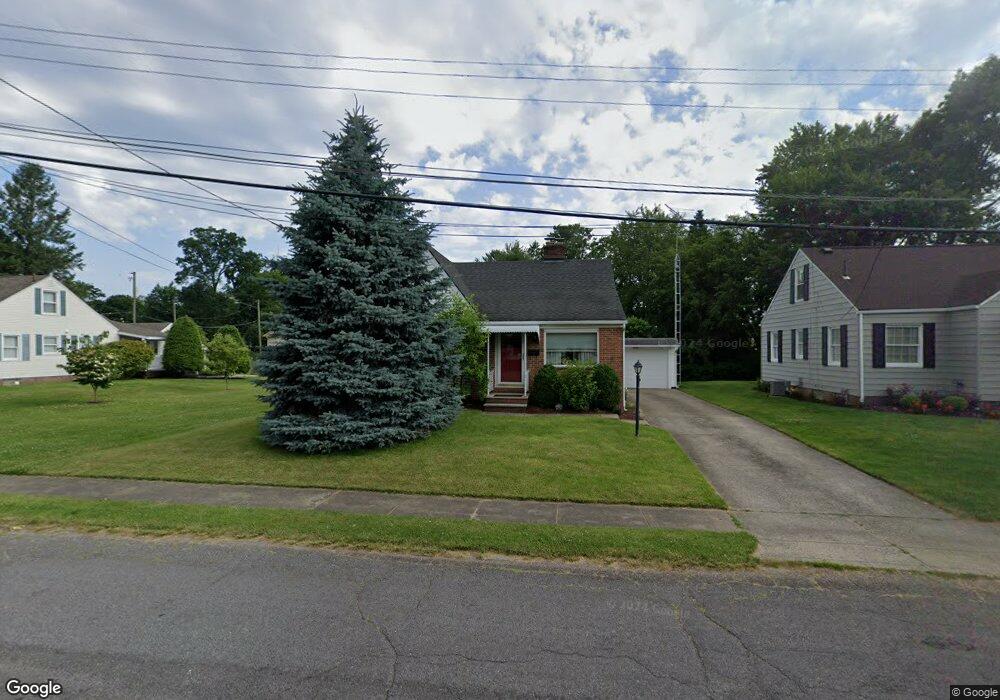
3727 10th St SW Canton, OH 44710
Estimated Value: $103,000 - $146,000
2
Beds
1
Bath
932
Sq Ft
$134/Sq Ft
Est. Value
About This Home
This home is located at 3727 10th St SW, Canton, OH 44710 and is currently estimated at $124,945, approximately $134 per square foot. 3727 10th St SW is a home located in Stark County with nearby schools including Harter Elementary School, Early Learning Center @ Schreiber, and Clarendon Intermediate School.
Ownership History
Date
Name
Owned For
Owner Type
Purchase Details
Closed on
Dec 8, 2008
Sold by
Jones Sally E
Bought by
Duffy James W and Duffy Eileen F
Current Estimated Value
Home Financials for this Owner
Home Financials are based on the most recent Mortgage that was taken out on this home.
Original Mortgage
$76,612
Outstanding Balance
$50,398
Interest Rate
6.04%
Mortgage Type
VA
Estimated Equity
$74,547
Purchase Details
Closed on
Apr 1, 2002
Sold by
Pireu Robert E and Pireu Marti
Bought by
Jones Sally E
Purchase Details
Closed on
Jun 10, 1996
Sold by
Eckels Betty J
Bought by
Pireu Robert E and Martin Marti
Home Financials for this Owner
Home Financials are based on the most recent Mortgage that was taken out on this home.
Original Mortgage
$64,600
Interest Rate
8%
Mortgage Type
New Conventional
Purchase Details
Closed on
Jan 21, 1993
Create a Home Valuation Report for This Property
The Home Valuation Report is an in-depth analysis detailing your home's value as well as a comparison with similar homes in the area
Home Values in the Area
Average Home Value in this Area
Purchase History
| Date | Buyer | Sale Price | Title Company |
|---|---|---|---|
| Duffy James W | $75,000 | Attorney | |
| Jones Sally E | $76,900 | -- | |
| Pireu Robert E | $68,000 | -- | |
| -- | -- | -- |
Source: Public Records
Mortgage History
| Date | Status | Borrower | Loan Amount |
|---|---|---|---|
| Open | Duffy James W | $76,612 | |
| Previous Owner | Pireu Robert E | $64,600 |
Source: Public Records
Tax History Compared to Growth
Tax History
| Year | Tax Paid | Tax Assessment Tax Assessment Total Assessment is a certain percentage of the fair market value that is determined by local assessors to be the total taxable value of land and additions on the property. | Land | Improvement |
|---|---|---|---|---|
| 2025 | -- | $30,940 | $8,960 | $21,980 |
| 2024 | -- | $30,940 | $8,960 | $21,980 |
| 2023 | $928 | $24,680 | $7,560 | $17,120 |
| 2022 | $928 | $24,680 | $7,560 | $17,120 |
| 2021 | $937 | $24,680 | $7,560 | $17,120 |
| 2020 | $774 | $20,510 | $6,230 | $14,280 |
| 2019 | $676 | $20,520 | $6,230 | $14,290 |
| 2018 | $680 | $20,520 | $6,230 | $14,290 |
| 2017 | $681 | $19,470 | $6,410 | $13,060 |
| 2016 | $893 | $22,800 | $6,410 | $16,390 |
| 2015 | $898 | $22,800 | $6,410 | $16,390 |
| 2014 | $891 | $21,840 | $6,160 | $15,680 |
| 2013 | $430 | $21,840 | $6,160 | $15,680 |
Source: Public Records
Map
Nearby Homes
- 914 Benskin Ave SW
- 3831 11th St SW
- 900 Raff Rd SW
- 3833 Greenwood Place SW
- 649 Bellflower Ave SW
- 1246 Raff Rd SW
- 1025 Shadyside Ave SW
- 3215 12th St SW
- 144 Aultman Ave NW
- 1013 Maryland Ave SW
- 846 Maryland Ave SW
- 180 Valleyview Ave NW
- 218 Raff Rd NW
- 4418 7th St SW
- 1259 Hawthorne Ave SW
- 118 Roslyn Ave NW
- 132 Delverne Ave SW
- 3029 7th St SW
- 145 Roslyn Ave NW
- 929 Wertz Ave SW
- 3737 10th St SW
- 3721 10th St SW
- 922 Benskin Ave SW
- 3728 10th St SW
- 3730 10th St SW
- 3724 10th St SW
- 939 Raff Rd SW
- 1001 Raff Rd SW
- 3801 10th St SW
- 1007 Raff Rd SW
- 3809 10th St SW
- 923 Benskin Ave SW
- 3725 11th St SW
- 3721 11th St SW
- 3804 10th St SW
- 1015 Raff Rd SW
- 3735 11th St SW
- 925 Raff Rd SW
- 3813 10th St SW
- 3803 11th St SW