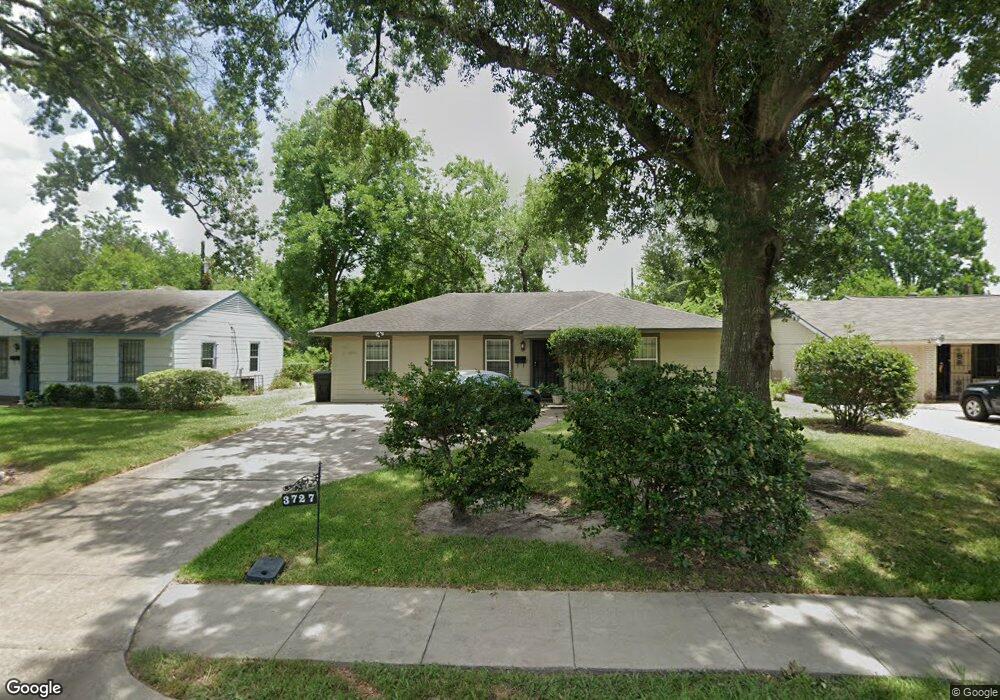
3727 Cosby St Houston, TX 77021
OST-South Union NeighborhoodEstimated Value: $134,000 - $199,000
2
Beds
1
Bath
936
Sq Ft
$178/Sq Ft
Est. Value
About This Home
This home is located at 3727 Cosby St, Houston, TX 77021 and is currently estimated at $166,424, approximately $177 per square foot. 3727 Cosby St is a home located in Harris County with nearby schools including Thompson Elementary School, Cullen Middle School, and Yates High School.
Ownership History
Date
Name
Owned For
Owner Type
Purchase Details
Closed on
Mar 5, 2007
Sold by
Long Eddie J
Bought by
Wilson Marchanel S
Current Estimated Value
Home Financials for this Owner
Home Financials are based on the most recent Mortgage that was taken out on this home.
Original Mortgage
$75,050
Outstanding Balance
$45,402
Interest Rate
6.25%
Mortgage Type
Purchase Money Mortgage
Estimated Equity
$121,022
Purchase Details
Closed on
Feb 8, 2007
Sold by
Long Jamaal A
Bought by
Long Eddie J
Home Financials for this Owner
Home Financials are based on the most recent Mortgage that was taken out on this home.
Original Mortgage
$75,050
Outstanding Balance
$45,402
Interest Rate
6.25%
Mortgage Type
Purchase Money Mortgage
Estimated Equity
$121,022
Purchase Details
Closed on
Jul 16, 2002
Sold by
Kelly Theodore
Bought by
Long Jamaal A
Create a Home Valuation Report for This Property
The Home Valuation Report is an in-depth analysis detailing your home's value as well as a comparison with similar homes in the area
Home Values in the Area
Average Home Value in this Area
Purchase History
| Date | Buyer | Sale Price | Title Company |
|---|---|---|---|
| Wilson Marchanel S | -- | Pinnacle Title Co | |
| Long Eddie J | -- | None Available | |
| Long Jamaal A | -- | Fidelity National Title |
Source: Public Records
Mortgage History
| Date | Status | Borrower | Loan Amount |
|---|---|---|---|
| Open | Wilson Marchanel S | $75,050 |
Source: Public Records
Tax History Compared to Growth
Tax History
| Year | Tax Paid | Tax Assessment Tax Assessment Total Assessment is a certain percentage of the fair market value that is determined by local assessors to be the total taxable value of land and additions on the property. | Land | Improvement |
|---|---|---|---|---|
| 2025 | $3,004 | $150,611 | $116,935 | $33,676 |
| 2024 | $3,004 | $143,581 | $111,924 | $31,657 |
| 2023 | $3,004 | $157,428 | $106,912 | $50,516 |
| 2022 | $2,792 | $126,813 | $86,866 | $39,947 |
| 2021 | $2,152 | $92,314 | $46,774 | $45,540 |
| 2020 | $1,994 | $82,337 | $46,774 | $35,563 |
| 2019 | $2,007 | $79,326 | $36,751 | $42,575 |
| 2018 | $1,085 | $68,968 | $30,069 | $38,899 |
| 2017 | $1,567 | $68,968 | $30,069 | $38,899 |
| 2016 | $1,425 | $56,350 | $20,046 | $36,304 |
| 2015 | $862 | $52,324 | $18,376 | $33,948 |
| 2014 | $862 | $50,387 | $18,376 | $32,011 |
Source: Public Records
Map
Nearby Homes