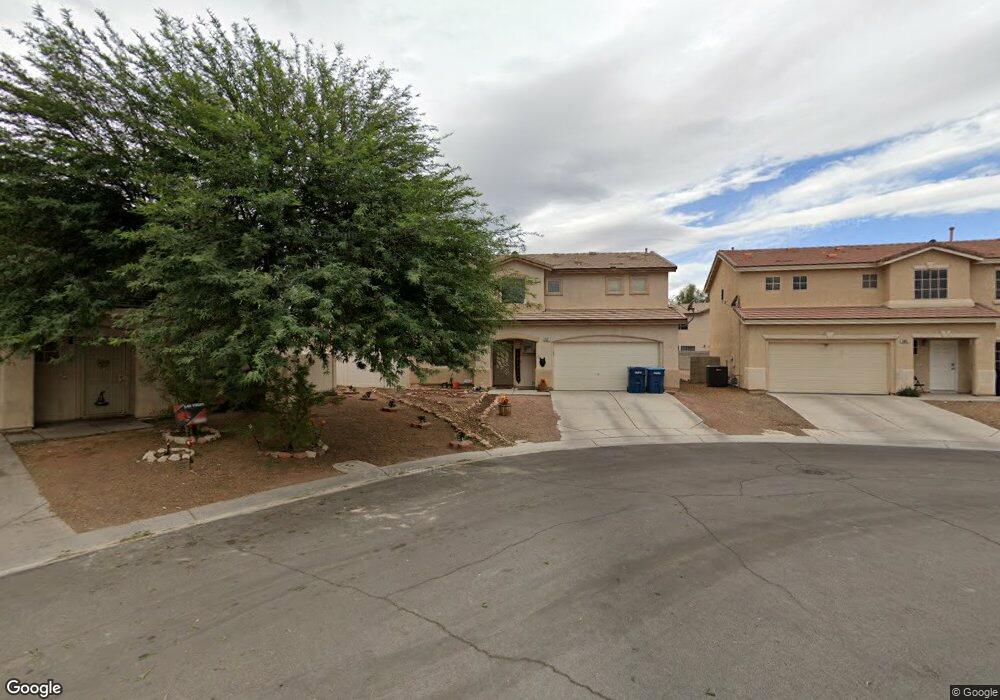
3727 Trellis View Ave Las Vegas, NV 89115
Estimated Value: $378,000 - $435,000
4
Beds
3
Baths
1,770
Sq Ft
$231/Sq Ft
Est. Value
About This Home
This home is located at 3727 Trellis View Ave, Las Vegas, NV 89115 and is currently estimated at $408,625, approximately $230 per square foot. 3727 Trellis View Ave is a home located in Clark County with nearby schools including Gwendolyn Woolley Elementary School, Clyde C. Cox Elementary School, and Marvin M Sedway Middle School.
Ownership History
Date
Name
Owned For
Owner Type
Purchase Details
Closed on
Dec 17, 2003
Sold by
Thomas Christian and Thomas Juanita
Bought by
Barnes Robert L and Barnes Debbie L
Current Estimated Value
Home Financials for this Owner
Home Financials are based on the most recent Mortgage that was taken out on this home.
Original Mortgage
$163,520
Outstanding Balance
$75,296
Interest Rate
5.79%
Mortgage Type
VA
Estimated Equity
$333,329
Purchase Details
Closed on
Jun 14, 2000
Sold by
Capital Pacific Holdings Llc
Bought by
Thomas Christian and Thomas Juanita
Home Financials for this Owner
Home Financials are based on the most recent Mortgage that was taken out on this home.
Original Mortgage
$128,892
Interest Rate
8.27%
Mortgage Type
FHA
Create a Home Valuation Report for This Property
The Home Valuation Report is an in-depth analysis detailing your home's value as well as a comparison with similar homes in the area
Home Values in the Area
Average Home Value in this Area
Purchase History
| Date | Buyer | Sale Price | Title Company |
|---|---|---|---|
| Barnes Robert L | $158,900 | United Title Of Nevada | |
| Thomas Christian | $129,955 | Nevada Title Company |
Source: Public Records
Mortgage History
| Date | Status | Borrower | Loan Amount |
|---|---|---|---|
| Open | Barnes Robert L | $163,520 | |
| Previous Owner | Thomas Christian | $128,892 |
Source: Public Records
Tax History Compared to Growth
Tax History
| Year | Tax Paid | Tax Assessment Tax Assessment Total Assessment is a certain percentage of the fair market value that is determined by local assessors to be the total taxable value of land and additions on the property. | Land | Improvement |
|---|---|---|---|---|
| 2025 | $1,685 | $107,165 | $25,900 | $81,265 |
| 2024 | $1,561 | $107,165 | $25,900 | $81,265 |
| 2023 | $1,561 | $104,418 | $28,000 | $76,418 |
| 2022 | $1,445 | $92,996 | $22,750 | $70,246 |
| 2021 | $1,339 | $87,725 | $21,000 | $66,725 |
| 2020 | $1,240 | $86,148 | $19,950 | $66,198 |
| 2019 | $1,162 | $80,623 | $15,400 | $65,223 |
| 2018 | $1,109 | $74,513 | $11,900 | $62,613 |
| 2017 | $2,170 | $73,981 | $10,500 | $63,481 |
| 2016 | $1,039 | $56,596 | $8,400 | $48,196 |
| 2015 | $1,036 | $48,406 | $5,600 | $42,806 |
| 2014 | $1,006 | $33,270 | $3,850 | $29,420 |
Source: Public Records
Map
Nearby Homes
- 3711 Southern Light Dr
- 3915 Eblick Wash Dr
- 3975 Eblick Wash Dr
- 4052 Rocky Beach Dr
- 3829 Northern Light Dr
- 4064 Rocky Beach Dr
- 3726 Glow Dr
- 3923 Via Lucia Dr
- 3711 Lone Oak St
- 3630 Three Bars Ct
- 3540 Purdue
- 3747 Gulliver St
- 4199 Dobson Dr
- 3501 Orvis St
- 4211 Dobson Dr
- 4024 Edwin Place
- 4232 Heller Dr
- 4102 Wendy Ln
- 3508 Rio Robles Dr Unit D
- 3508 Rio Robles Dr Unit C
- 3735 Trellis View Ave
- 3951 Dutch Elm Dr Unit 2
- 3728 Walnut Green Ave
- 3720 Walnut Green Ave
- 3736 Walnut Green Ave
- 3940 Timberlake Dr
- 3930 Timberlake Dr
- 3743 Trellis View Ave
- 3950 Timberlake Dr
- 3961 Dutch Elm Dr
- 3920 Timberlake Dr
- 3744 Walnut Green Ave
- 3960 Timberlake Dr
- 3742 Trellis View Ave
- 3751 Trellis View Ave
- 3971 Dutch Elm Dr
- 3752 Walnut Green Ave
- 3901 Melbourne Way
- 3970 Timberlake Dr
- 3750 Trellis View Ave