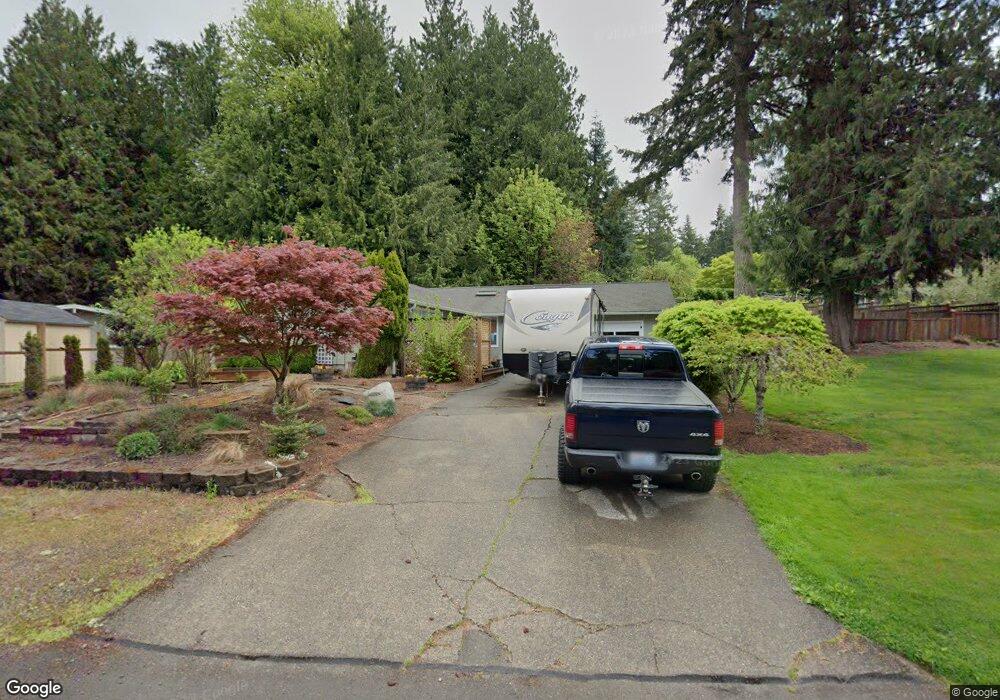
3727 Wesley Loop NW Olympia, WA 98502
Estimated Value: $553,302 - $703,000
3
Beds
2
Baths
1,808
Sq Ft
$337/Sq Ft
Est. Value
About This Home
This home is located at 3727 Wesley Loop NW, Olympia, WA 98502 and is currently estimated at $609,076, approximately $336 per square foot. 3727 Wesley Loop NW is a home located in Thurston County with nearby schools including Leland P. Brown Elementary School, Jefferson Middle School, and Capital High School.
Ownership History
Date
Name
Owned For
Owner Type
Purchase Details
Closed on
Jan 26, 2022
Sold by
Kantas Tony G
Bought by
Kantas Anthony Gabriel
Current Estimated Value
Purchase Details
Closed on
Jan 24, 2006
Sold by
Kantas Beth M
Bought by
Kantas Tony G
Home Financials for this Owner
Home Financials are based on the most recent Mortgage that was taken out on this home.
Original Mortgage
$215,600
Interest Rate
6.28%
Mortgage Type
Fannie Mae Freddie Mac
Purchase Details
Closed on
Jul 9, 2002
Sold by
Lewis Claudia L
Bought by
Kantas Tony G and Kantas Beth M
Home Financials for this Owner
Home Financials are based on the most recent Mortgage that was taken out on this home.
Original Mortgage
$148,400
Interest Rate
6.71%
Create a Home Valuation Report for This Property
The Home Valuation Report is an in-depth analysis detailing your home's value as well as a comparison with similar homes in the area
Home Values in the Area
Average Home Value in this Area
Purchase History
| Date | Buyer | Sale Price | Title Company |
|---|---|---|---|
| Kantas Anthony Gabriel | -- | Thurston County Title | |
| Kantas Tony G | -- | First American Title | |
| Kantas Tony G | $185,500 | Chicago Title Insurance Co |
Source: Public Records
Mortgage History
| Date | Status | Borrower | Loan Amount |
|---|---|---|---|
| Previous Owner | Kantas Tony G | $215,600 | |
| Previous Owner | Kantas Tony G | $148,400 |
Source: Public Records
Tax History Compared to Growth
Tax History
| Year | Tax Paid | Tax Assessment Tax Assessment Total Assessment is a certain percentage of the fair market value that is determined by local assessors to be the total taxable value of land and additions on the property. | Land | Improvement |
|---|---|---|---|---|
| 2024 | $5,014 | $466,700 | $185,500 | $281,200 |
| 2023 | $5,014 | $447,300 | $187,700 | $259,600 |
| 2022 | $4,807 | $424,900 | $150,600 | $274,300 |
| 2021 | $4,483 | $382,000 | $124,700 | $257,300 |
| 2020 | $4,136 | $323,200 | $132,800 | $190,400 |
| 2019 | $3,486 | $291,100 | $74,400 | $216,700 |
| 2018 | $3,562 | $256,100 | $65,700 | $190,400 |
| 2017 | $3,146 | $233,100 | $69,700 | $163,400 |
| 2016 | $3,054 | $228,700 | $81,400 | $147,300 |
| 2014 | -- | $223,300 | $81,400 | $141,900 |
Source: Public Records
Map
Nearby Homes
- 2920 39th Ln NW
- 4211 Green Cove St NW
- 3019 36th Ave NW
- 2609 Country Club Ct NW
- 4138 Cooper Point Rd NW
- 3226 Cooper Point Rd NW
- 3133 32nd Ave NW
- 2718 43rd Ave NW
- 2702 43rd Ave NW
- 2734 43rd Ave NW
- 2912 31st Ave NW
- 4211 Leavelle St NW
- 3301 French Loop NW
- 2800 Westwood Dr NW
- 4518 Ridgewood Ct NW
- 2626 28th Ave NW
- 2222 Old Port Ct NW
- 2641 28th Ave NW
- 5023 Cooper Point Rd NW
- 2316 Cooper Crest Place NW
- 3723 Wesley Loop NW
- 3722 Wesley Loop NW
- 3731 Wesley Loop NW
- 3709 Wesley Loop NW
- 3707 Wesley Loop NW
- 3715 Wesley Loop NW
- 3724 Wesley Loop NW
- 3705 Wesley Loop NW
- 3728 Wesley Loop NW
- 3726 Wesley Loop NW
- 3730 Wesley Loop NW
- 3733 Wesley Loop NW
- 3720 Wesley Loop NW
- 3703 Wesley Loop NW
- 3718 Wesley Loop NW
- 3732 Wesley Loop NW
- 3708 Wesley Loop NW Unit A & B
- 3708 Wesley Loop NW
- 3706 Wesley Loop NW
- 3710 Wesley Loop NW