37271 Filbert St Newark, CA 94560
Estimated Value: $697,233 - $883,000
1
Bed
1
Bath
528
Sq Ft
$1,527/Sq Ft
Est. Value
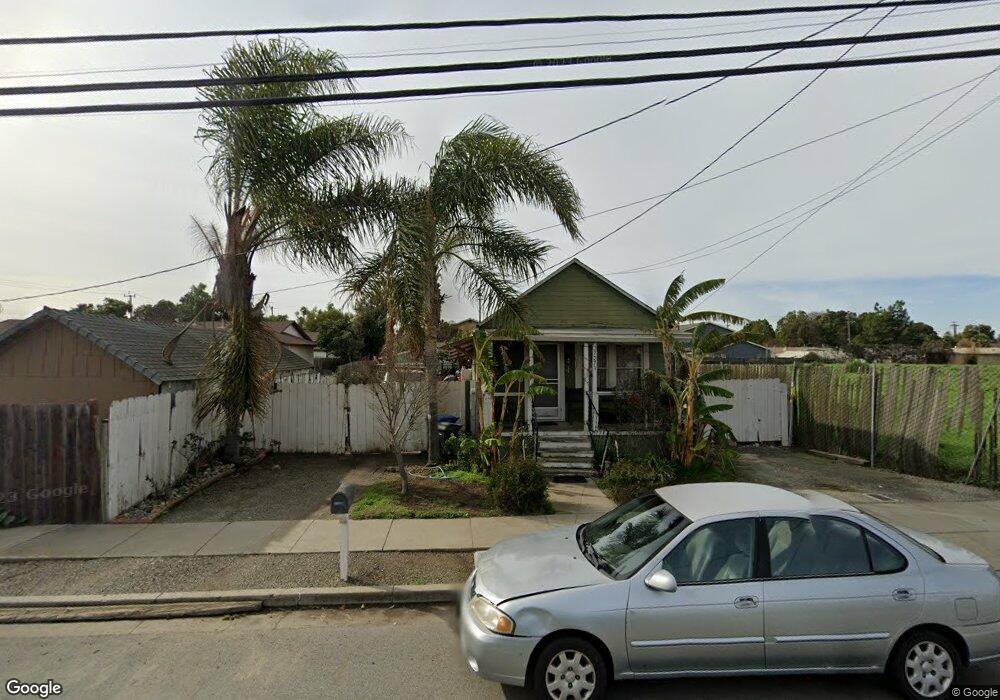
About This Home
This home is located at 37271 Filbert St, Newark, CA 94560 and is currently estimated at $806,308, approximately $1,527 per square foot. 37271 Filbert St is a home located in Alameda County with nearby schools including August Schilling Elementary School, Newark Junior High School, and Newark Memorial High School.
Ownership History
Date
Name
Owned For
Owner Type
Purchase Details
Closed on
Sep 9, 2005
Sold by
Anastanio Linda J and Will Of Maurice J Silva
Bought by
Ruelas Jose and Mora Ana
Current Estimated Value
Home Financials for this Owner
Home Financials are based on the most recent Mortgage that was taken out on this home.
Original Mortgage
$320,000
Outstanding Balance
$170,231
Interest Rate
5.76%
Mortgage Type
Fannie Mae Freddie Mac
Estimated Equity
$636,077
Create a Home Valuation Report for This Property
The Home Valuation Report is an in-depth analysis detailing your home's value as well as a comparison with similar homes in the area
Home Values in the Area
Average Home Value in this Area
Purchase History
| Date | Buyer | Sale Price | Title Company |
|---|---|---|---|
| Ruelas Jose | $400,000 | Chicago Title Co |
Source: Public Records
Mortgage History
| Date | Status | Borrower | Loan Amount |
|---|---|---|---|
| Open | Ruelas Jose | $320,000 |
Source: Public Records
Tax History
| Year | Tax Paid | Tax Assessment Tax Assessment Total Assessment is a certain percentage of the fair market value that is determined by local assessors to be the total taxable value of land and additions on the property. | Land | Improvement |
|---|---|---|---|---|
| 2025 | $6,857 | $539,583 | $437,267 | $109,316 |
| 2024 | $6,857 | $528,867 | $428,694 | $107,173 |
| 2023 | $6,665 | $525,363 | $420,291 | $105,072 |
| 2022 | $6,572 | $508,063 | $412,051 | $103,012 |
| 2021 | $6,409 | $497,967 | $403,974 | $100,993 |
| 2020 | $6,303 | $499,791 | $399,833 | $99,958 |
| 2019 | $6,213 | $489,995 | $391,996 | $97,999 |
| 2018 | $6,118 | $480,391 | $384,313 | $96,078 |
| 2017 | $5,962 | $470,975 | $376,780 | $94,195 |
| 2016 | $5,163 | $400,000 | $120,000 | $280,000 |
| 2015 | $4,256 | $320,000 | $150,000 | $170,000 |
| 2014 | $3,615 | $270,000 | $81,000 | $189,000 |
Source: Public Records
Map
Nearby Homes
- 7350 Carter Ave
- 6417/6433 Thornton Ave
- 37054 Locust St Unit ABC
- 7843 Railroad Ave
- 37029 Olive St
- 37266 Spruce St
- 36871 Locust St
- 6759 Albyn Ct
- 36985 Walnut St
- 36923 Walnut St
- 37052 Poplar St
- 7601 Redbud Ct
- 36569 Beutke Dr
- 8420 Blue Anchor Way
- 37645 Bay Crest Rd
- 6169 Thornton Ave Unit B
- 36671 Ponderosa Ct
- 6241 Cotton Ave
- 36347 Colbert Place
- 8093 Del Monte Ave
Your Personal Tour Guide
Ask me questions while you tour the home.