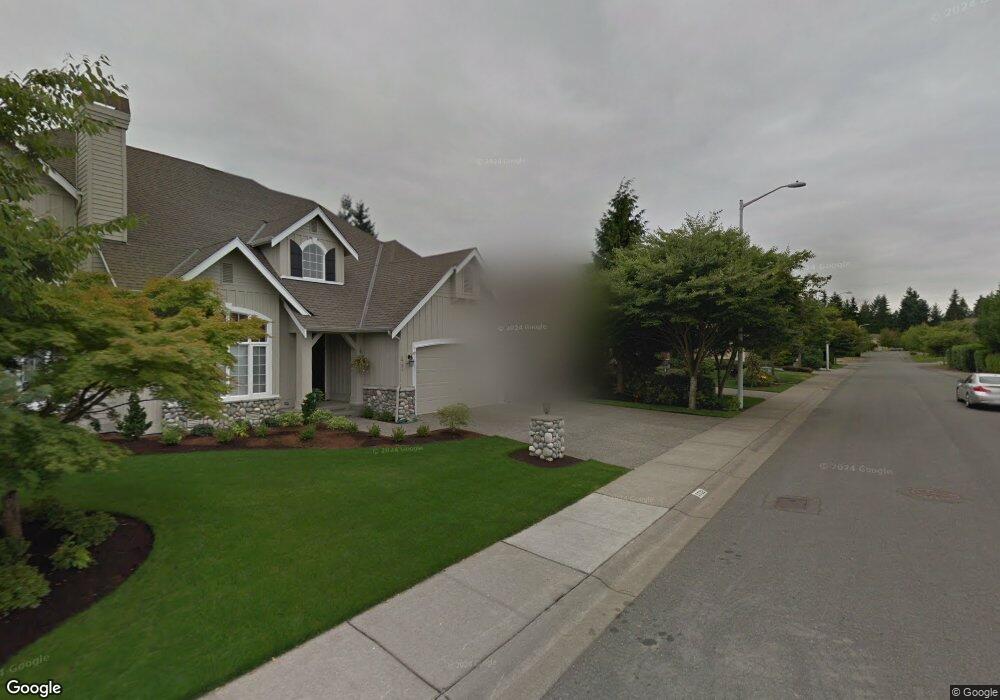
3728 209th Place SE Bothell, WA 98021
Canyon Creek NeighborhoodEstimated Value: $1,857,000 - $2,021,000
4
Beds
4
Baths
4,119
Sq Ft
$466/Sq Ft
Est. Value
About This Home
This home is located at 3728 209th Place SE, Bothell, WA 98021 and is currently estimated at $1,917,797, approximately $465 per square foot. 3728 209th Place SE is a home located in Snohomish County with nearby schools including Canyon Creek Elementary School, Skyview Middle School, and North Creek High School.
Ownership History
Date
Name
Owned For
Owner Type
Purchase Details
Closed on
Nov 17, 2016
Sold by
Kaltsounis Maria G
Bought by
Kaltsounis Maria G
Current Estimated Value
Purchase Details
Closed on
Oct 17, 2016
Sold by
Kaltsounis Maria G
Bought by
Kaltsounis Maria G
Purchase Details
Closed on
Nov 18, 2002
Sold by
Koura Dale C and Juanita Koura I
Bought by
Kaltsounis Theodore and Kaltsounis Maria G
Home Financials for this Owner
Home Financials are based on the most recent Mortgage that was taken out on this home.
Original Mortgage
$50,000
Outstanding Balance
$20,107
Interest Rate
6.12%
Estimated Equity
$1,897,691
Purchase Details
Closed on
Jun 12, 2001
Sold by
Windsor Premier Homes Inc
Bought by
Koura Dale C and Juanita Koura I
Home Financials for this Owner
Home Financials are based on the most recent Mortgage that was taken out on this home.
Original Mortgage
$426,800
Interest Rate
6.66%
Create a Home Valuation Report for This Property
The Home Valuation Report is an in-depth analysis detailing your home's value as well as a comparison with similar homes in the area
Home Values in the Area
Average Home Value in this Area
Purchase History
| Date | Buyer | Sale Price | Title Company |
|---|---|---|---|
| Kaltsounis Maria G | -- | None Available | |
| Kaltsounis Maria G | -- | None Available | |
| Kaltsounis Theodore | $540,500 | Stewart | |
| Koura Dale C | $533,500 | -- |
Source: Public Records
Mortgage History
| Date | Status | Borrower | Loan Amount |
|---|---|---|---|
| Open | Kaltsounis Theodore | $50,000 | |
| Previous Owner | Koura Dale C | $426,800 | |
| Closed | Koura Dale C | $53,350 |
Source: Public Records
Tax History
| Year | Tax Paid | Tax Assessment Tax Assessment Total Assessment is a certain percentage of the fair market value that is determined by local assessors to be the total taxable value of land and additions on the property. | Land | Improvement |
|---|---|---|---|---|
| 2026 | $14,780 | $1,774,900 | $824,400 | $950,500 |
| 2025 | $13,306 | $1,658,700 | $735,000 | $923,700 |
| 2024 | $13,306 | $1,493,300 | $643,000 | $850,300 |
| 2023 | $12,138 | $1,516,800 | $745,000 | $771,800 |
| 2022 | $11,240 | $1,117,200 | $460,000 | $657,200 |
| 2020 | $10,628 | $997,300 | $420,000 | $577,300 |
| 2019 | $9,259 | $878,700 | $335,000 | $543,700 |
| 2018 | $8,787 | $776,600 | $290,000 | $486,600 |
| 2017 | $7,701 | $693,000 | $235,000 | $458,000 |
| 2016 | $8,316 | $731,900 | $215,000 | $516,900 |
| 2015 | $8,126 | $679,500 | $200,000 | $479,500 |
| 2013 | $7,520 | $560,100 | $145,800 | $414,300 |
Source: Public Records
Map
Nearby Homes
- 3918 214th Place SE Unit A
- 3323 207th Place SE
- 3928 214th Place SE Unit B
- 4001 215th St SE Unit A
- 4026 215th Place SE
- 20911 30th Dr SE
- 21705 38th Dr SE
- 20500 32nd Dr SE
- 21417 43rd Dr SE Unit 19
- 20501 31st Dr SE
- 3618 202nd St SE
- 3422 201st Place SE
- 4215 220th St SE
- 4219 220th St SE
- 4103 220th St SE
- 4426 216th Place SE
- 3912 199th Place SE
- 3931 221st Place SE
- 20327 45th Dr SE
- 3924 190th Place SE
- 3729 209th Place SE
- 3732 209th Place SE
- 3722 209th Place SE
- 3714 209th Place SE
- 3808 209th St SE
- 3808 209th Place SE
- 20912 39th Ave SE
- 21004 39th Ave SE
- 21034 37th Ave SE
- 3806 209th St SE
- 3814 209th Place SE
- 20925 37th Ave SE
- 20929 37th Ave SE
- 21006 39th Ave SE
- 21006 39th Ave SE Unit 1
- 3812 209th St SE
- 20915 37th Ave SE
- 3820 209th Place SE
- 21005 37th Ave SE
- 21012 39th Ave SE
Your Personal Tour Guide
Ask me questions while you tour the home.