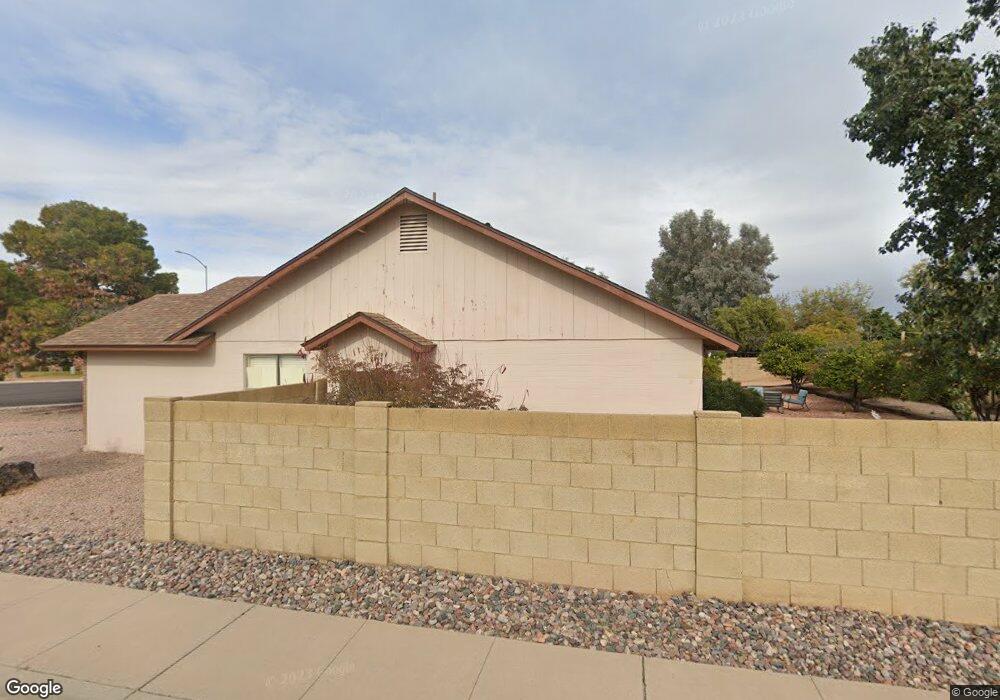
3728 E Dragoon Ave Mesa, AZ 85206
Central Mesa NeighborhoodEstimated Value: $434,271 - $519,000
Studio
2
Baths
1,863
Sq Ft
$258/Sq Ft
Est. Value
About This Home
This home is located at 3728 E Dragoon Ave, Mesa, AZ 85206 and is currently estimated at $480,568, approximately $257 per square foot. 3728 E Dragoon Ave is a home located in Maricopa County with nearby schools including Johnson Elementary School, Franklin at Brimhall Elementary School, and Franklin West Elementary School.
Ownership History
Date
Name
Owned For
Owner Type
Purchase Details
Closed on
Aug 13, 2022
Sold by
Hallare and Alice
Bought by
Hallare Family Living Trust
Current Estimated Value
Purchase Details
Closed on
Mar 24, 2006
Sold by
Leinart Charles W
Bought by
Hallare Clark
Home Financials for this Owner
Home Financials are based on the most recent Mortgage that was taken out on this home.
Original Mortgage
$152,000
Interest Rate
6.25%
Mortgage Type
Credit Line Revolving
Purchase Details
Closed on
Mar 23, 2006
Sold by
Hallare Clark V
Bought by
Hallare Clark and Hallare Alice
Home Financials for this Owner
Home Financials are based on the most recent Mortgage that was taken out on this home.
Original Mortgage
$152,000
Interest Rate
6.25%
Mortgage Type
Credit Line Revolving
Purchase Details
Closed on
Jun 9, 2004
Sold by
Leinart Marissa A
Bought by
Hallare Clark
Purchase Details
Closed on
Aug 20, 1999
Sold by
Hallare M D Ramon G
Bought by
Leinart Marissa A
Create a Home Valuation Report for This Property
The Home Valuation Report is an in-depth analysis detailing your home's value as well as a comparison with similar homes in the area
Home Values in the Area
Average Home Value in this Area
Purchase History
| Date | Buyer | Sale Price | Title Company |
|---|---|---|---|
| Hallare Family Living Trust | -- | None Listed On Document | |
| Hallare Clark | -- | Transnation Title Ins Co | |
| Hallare Clark | -- | Transnation Title Ins Co | |
| Hallare Clark | -- | -- | |
| Leinart Marissa A | -- | -- |
Source: Public Records
Mortgage History
| Date | Status | Borrower | Loan Amount |
|---|---|---|---|
| Previous Owner | Hallare Clark | $152,000 |
Source: Public Records
Tax History
| Year | Tax Paid | Tax Assessment Tax Assessment Total Assessment is a certain percentage of the fair market value that is determined by local assessors to be the total taxable value of land and additions on the property. | Land | Improvement |
|---|---|---|---|---|
| 2025 | $2,051 | $20,789 | -- | -- |
| 2024 | $2,057 | $19,799 | -- | -- |
| 2023 | $2,057 | $33,160 | $6,630 | $26,530 |
| 2022 | $2,015 | $26,360 | $5,270 | $21,090 |
| 2021 | $2,039 | $25,130 | $5,020 | $20,110 |
| 2020 | $2,013 | $25,020 | $5,000 | $20,020 |
| 2019 | $1,881 | $22,880 | $4,570 | $18,310 |
| 2018 | $1,805 | $21,210 | $4,240 | $16,970 |
| 2017 | $1,751 | $19,300 | $3,860 | $15,440 |
| 2016 | $1,719 | $19,160 | $3,830 | $15,330 |
| 2015 | $1,615 | $18,250 | $3,650 | $14,600 |
Source: Public Records
Map
Nearby Homes
- 3544 E Diamond Ave
- 3755 E Broadway Rd Unit 96
- 921 S Val Vista Dr Unit 135
- 921 S Val Vista Dr Unit 83
- 921 S Val Vista Dr Unit 11
- 441 S Maple Unit 95
- 441 S Maple Unit 8
- 712 S 34th St
- 4022 E Carol Cir
- 305 S Val Vista Dr Unit 78
- 305 S Val Vista Dr Unit 193
- 305 S Val Vista Dr Unit 436
- 305 S Val Vista Dr Unit 280
- 305 S Val Vista Dr Unit 71
- 305 S Val Vista Dr Unit 94
- 305 S Val Vista Dr Unit 188
- 305 S Val Vista Dr Unit 207
- 305 S Val Vista Dr Unit 49
- 305 S Val Vista Dr Unit 328
- 305 S Val Vista Dr Unit 315
- 3746 E Dragoon Ave
- 3724 E Dragoon Ave
- 3735 E Dragoon Ave
- 3750 E Dragoon Ave
- 3723 E Dragoon Ave
- 3743 E Dragoon Ave
- 10347 S Dragoon Ave
- 3716 E Dragoon Ave
- 3720 E Dragoon Ave
- 3717 E Dragoon Ave
- 3735 E Clovis Ave
- 3729 E Clovis Ave
- 3725 E Clovis Ave
- 3753 E Dragoon Ave
- 3793 E Clovis Ave
- 3723 E Clovis Ave
- 3746 E Dewberry Ave
- 3736 E Dewberry Ave
- 3709 E Dragoon Ave
- 3754 E Dragoon Ave
Your Personal Tour Guide
Ask me questions while you tour the home.