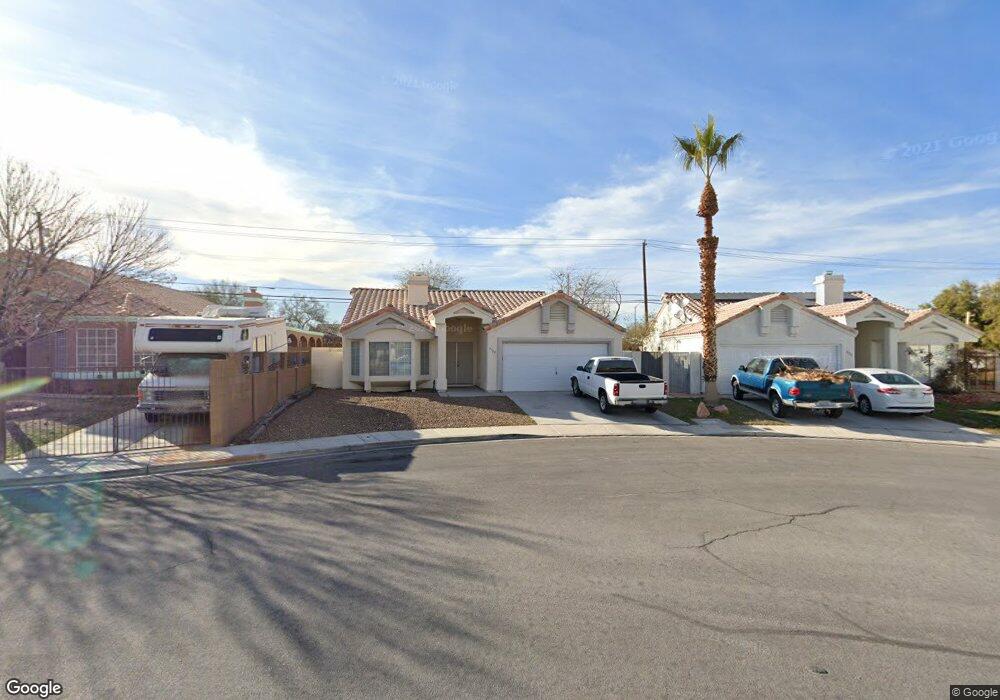
3729 Hedge Grove Dr North Las Vegas, NV 89032
Cheyenne NeighborhoodEstimated Value: $379,887 - $387,000
3
Beds
2
Baths
1,581
Sq Ft
$243/Sq Ft
Est. Value
About This Home
This home is located at 3729 Hedge Grove Dr, North Las Vegas, NV 89032 and is currently estimated at $383,972, approximately $242 per square foot. 3729 Hedge Grove Dr is a home located in Clark County with nearby schools including Elizabeth Wilhelm Elementary School, Dr. Claude G Perkins Elementary School, and Marvin M Sedway Middle School.
Ownership History
Date
Name
Owned For
Owner Type
Purchase Details
Closed on
Sep 24, 2013
Sold by
Rosenbaum Rowena and Powell Rowena Liscano
Bought by
Powell Jeffrey D
Current Estimated Value
Purchase Details
Closed on
Nov 20, 1997
Sold by
Powell Jeffrey D and Powell Rowena Liscano
Bought by
Powell Jeffrey D and Powell Rowena Liscano
Home Financials for this Owner
Home Financials are based on the most recent Mortgage that was taken out on this home.
Original Mortgage
$98,000
Interest Rate
7.33%
Purchase Details
Closed on
Sep 26, 1994
Sold by
Silver Development Inc
Bought by
Powell Jeffrey D and Liscano Rowena J
Home Financials for this Owner
Home Financials are based on the most recent Mortgage that was taken out on this home.
Original Mortgage
$99,350
Interest Rate
3.87%
Create a Home Valuation Report for This Property
The Home Valuation Report is an in-depth analysis detailing your home's value as well as a comparison with similar homes in the area
Home Values in the Area
Average Home Value in this Area
Purchase History
| Date | Buyer | Sale Price | Title Company |
|---|---|---|---|
| Powell Jeffrey D | -- | Fidelity National Title | |
| Powell Jeffrey D | -- | Nevada Title Company | |
| Powell Jeffrey D | $110,500 | Land Title |
Source: Public Records
Mortgage History
| Date | Status | Borrower | Loan Amount |
|---|---|---|---|
| Previous Owner | Powell Jeffrey D | $98,000 | |
| Previous Owner | Powell Jeffrey D | $99,350 |
Source: Public Records
Tax History Compared to Growth
Tax History
| Year | Tax Paid | Tax Assessment Tax Assessment Total Assessment is a certain percentage of the fair market value that is determined by local assessors to be the total taxable value of land and additions on the property. | Land | Improvement |
|---|---|---|---|---|
| 2025 | $1,743 | $82,688 | $27,300 | $55,388 |
| 2024 | $1,614 | $82,688 | $27,300 | $55,388 |
| 2023 | $1,075 | $81,602 | $28,700 | $52,902 |
| 2022 | $1,495 | $71,570 | $23,100 | $48,470 |
| 2021 | $1,384 | $67,927 | $21,700 | $46,227 |
| 2020 | $1,283 | $66,655 | $20,650 | $46,005 |
| 2019 | $1,202 | $61,880 | $16,450 | $45,430 |
| 2018 | $1,147 | $57,849 | $14,000 | $43,849 |
| 2017 | $1,904 | $56,763 | $12,250 | $44,513 |
| 2016 | $1,075 | $45,846 | $9,100 | $36,746 |
| 2015 | $1,071 | $36,258 | $7,000 | $29,258 |
| 2014 | $1,038 | $30,283 | $5,250 | $25,033 |
Source: Public Records
Map
Nearby Homes
- 3644 Quail Creek Dr
- 3839 Dusty Glen Ct
- 1608 Knoll Heights Ct
- 3743 Nairobi Ln
- 3804 Debussy Way
- 1822 Trigger Way
- 3317 Spinet Dr
- 4028 Spring Line St
- 1881 W Alexander Rd Unit 1092
- 1881 W Alexander Rd Unit 1100
- 1881 W Alexander Rd Unit 2079
- 4052 Clove Hitch St
- 3841 Intermezzo Way
- 0 June Unit 2706697
- 0 June Unit 2692591
- 0 Tamerind St Unit 2685915
- 0 0 Cheyenne & Englestad Unit 1536141
- 0 0 Englestad Cheyenne Unit 1635643
- 1002 Christopher View Ave Unit 2
- 641 Bay Bridge Dr
- 3725 Hedge Grove Dr
- 3733 Hedge Grove Dr
- 3721 Hedge Grove Dr
- 3717 Hedge Grove Dr
- 3728 Hedge Grove Dr
- 1416 Indian Hedge Dr
- 3724 Hedge Grove Dr
- 3724 Brentcove Dr
- 1461 Watercreek Dr
- 3720 Brentcove Dr Unit 2A
- 1471 Watercreek Dr
- 3713 Hedge Grove Dr
- 3720 Hedge Grove Dr
- 1412 Indian Hedge Dr
- 3728 Brentcove Dr
- 1451 Watercreek Dr
- 3716 Brentcove Dr
- 1441 Watercreek Dr
- 3712 Brentcove Dr
- 3716 Hedge Grove Dr