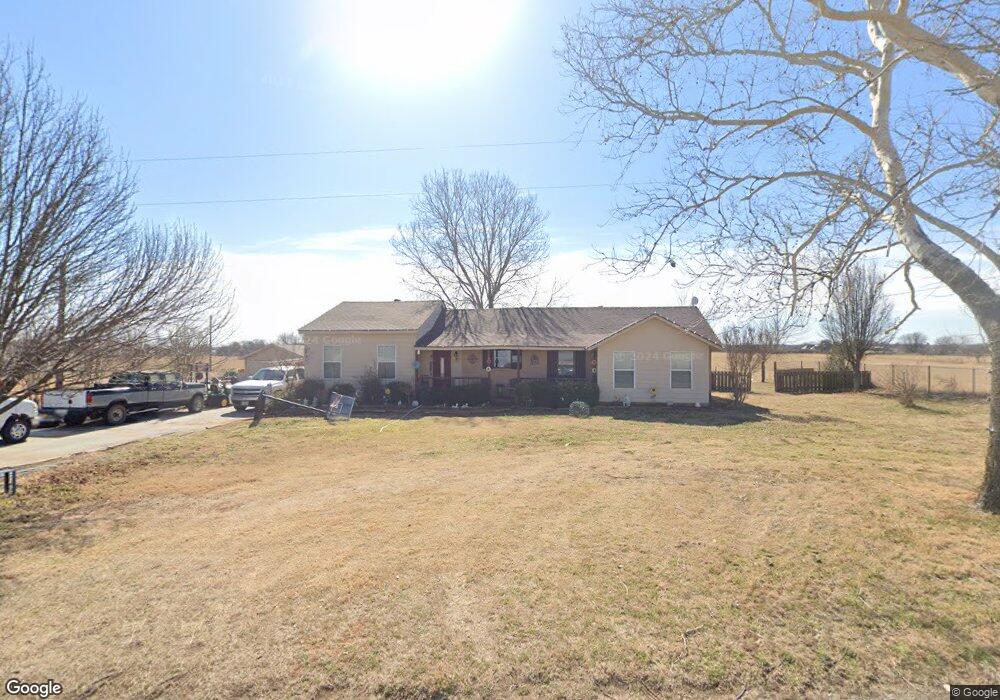
373 County Road 3332 Bridgeport, TX 76426
Estimated Value: $376,597 - $540,000
3
Beds
2
Baths
1,800
Sq Ft
$255/Sq Ft
Est. Value
About This Home
This home is located at 373 County Road 3332, Bridgeport, TX 76426 and is currently estimated at $458,299, approximately $254 per square foot. 373 County Road 3332 is a home located in Wise County with nearby schools including Paradise Elementary School, Paradise Intermediate School, and Paradise Junior High School.
Ownership History
Date
Name
Owned For
Owner Type
Purchase Details
Closed on
Jul 22, 2015
Sold by
Prill Linzee L and Porter Travis
Bought by
Helton Hal and Helton Tamara
Current Estimated Value
Home Financials for this Owner
Home Financials are based on the most recent Mortgage that was taken out on this home.
Original Mortgage
$191,211
Outstanding Balance
$150,181
Interest Rate
4.07%
Mortgage Type
New Conventional
Estimated Equity
$308,118
Purchase Details
Closed on
May 30, 2006
Sold by
Lowery Greg and Lowery Mirenda
Bought by
Prill Linzee L
Home Financials for this Owner
Home Financials are based on the most recent Mortgage that was taken out on this home.
Original Mortgage
$132,949
Interest Rate
6.5%
Mortgage Type
FHA
Purchase Details
Closed on
Jul 11, 2001
Sold by
Holt Norine
Bought by
Helton Hal and Helton Tamara
Create a Home Valuation Report for This Property
The Home Valuation Report is an in-depth analysis detailing your home's value as well as a comparison with similar homes in the area
Home Values in the Area
Average Home Value in this Area
Purchase History
| Date | Buyer | Sale Price | Title Company |
|---|---|---|---|
| Helton Hal | -- | None Available | |
| Prill Linzee L | -- | Universal Land Title Of Nort | |
| Helton Hal | -- | -- |
Source: Public Records
Mortgage History
| Date | Status | Borrower | Loan Amount |
|---|---|---|---|
| Open | Helton Hal | $191,211 | |
| Previous Owner | Prill Linzee L | $132,949 |
Source: Public Records
Tax History Compared to Growth
Tax History
| Year | Tax Paid | Tax Assessment Tax Assessment Total Assessment is a certain percentage of the fair market value that is determined by local assessors to be the total taxable value of land and additions on the property. | Land | Improvement |
|---|---|---|---|---|
| 2025 | $2,367 | $253,102 | $30,231 | $222,871 |
| 2024 | $2,367 | $255,524 | $30,188 | $225,336 |
| 2023 | $3,337 | $430,930 | $0 | $0 |
| 2022 | $3,141 | $365,106 | $0 | $0 |
| 2021 | $3,054 | $335,520 | $174,520 | $161,000 |
| 2020 | $2,915 | $291,350 | $134,120 | $157,230 |
| 2019 | $2,947 | $285,250 | $134,120 | $151,130 |
| 2018 | $2,862 | $253,630 | $105,840 | $147,790 |
| 2017 | $2,611 | $214,950 | $77,890 | $137,060 |
| 2016 | $2,420 | $194,580 | $68,520 | $126,060 |
| 2015 | -- | $150,170 | $64,480 | $85,690 |
| 2014 | -- | $93,670 | $7,980 | $85,690 |
Source: Public Records
Map
Nearby Homes
- 340 County Road 3336
- 886 County Road 3341
- 611 County Road 3214
- The Silverwood Plan at Honeysuckle Ranch
- The Sydney Plan at Honeysuckle Ranch
- The Caddo Plan at Honeysuckle Ranch
- The Salado Plan at Honeysuckle Ranch
- The Bradford Plan at Honeysuckle Ranch
- The Cibolo Plan at Honeysuckle Ranch
- The Leona II Plan at Honeysuckle Ranch
- The Carter Plan at Honeysuckle Ranch
- The Renner Plan at Honeysuckle Ranch
- The Colorado II Plan at Honeysuckle Ranch
- The Campbell Plan at Honeysuckle Ranch
- The Aubrey Plan at Honeysuckle Ranch
- The Aylin Plan at Honeysuckle Ranch
- The Sapphire Ranch II Plan at Honeysuckle Ranch
- 485 Honeysuckle
- 00 County Road 3342
- 165 Lonicera Ln
- 373 County Road 3332
- 345 County Road 3332
- 263 County Road 3332
- 127 County Road 3332
- 127 County Road 3332
- 000 County Rd 3241
- 000 Cr 3241
- 0 County Road 3241 Unit 13111928
- 0 County Road 3241 Unit 11399157
- 1138 County Road 3225
- 259 County Road 3332
- 0 Tbd Cr 3332
- 1024 County Road 3225
- 1024 County Road 3225
- 743 County Road 3241
- 762 County Road 3241
- 2274 County Road 3250
- 2454 County Road 3250
- TBD Hwy 114
- Lot 6 County Road 3332