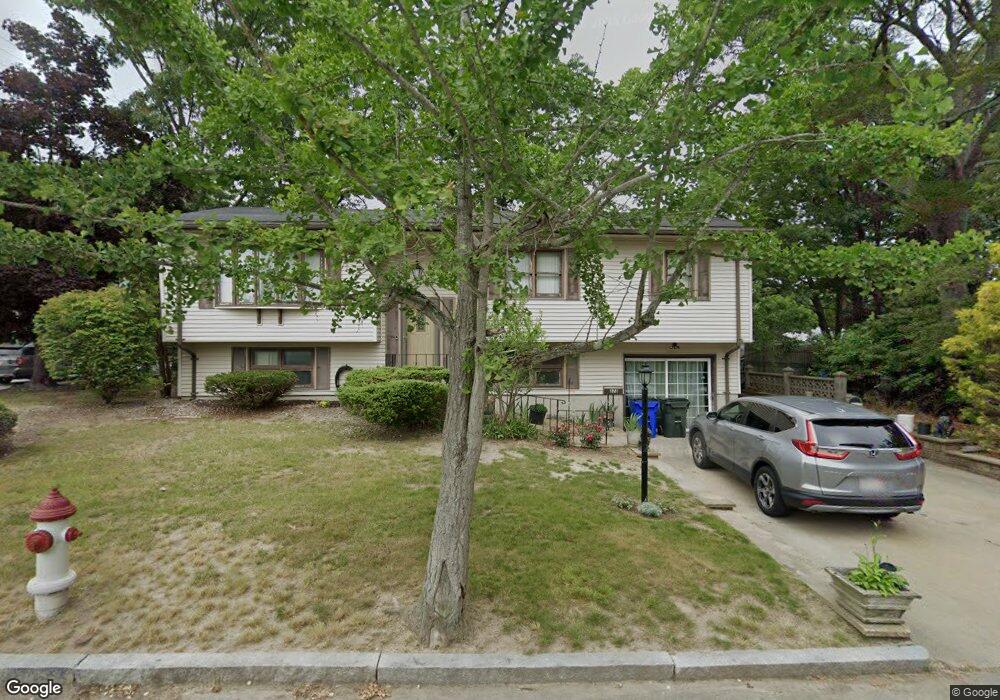
373 Dunbar St Fall River, MA 02723
Bank Street NeighborhoodEstimated Value: $484,968 - $603,000
3
Beds
3
Baths
2,280
Sq Ft
$232/Sq Ft
Est. Value
About This Home
This home is located at 373 Dunbar St, Fall River, MA 02723 and is currently estimated at $528,742, approximately $231 per square foot. 373 Dunbar St is a home located in Bristol County with nearby schools including Mary Fonseca Elementary School, Talbot Innovation School, and B M C Durfee High School.
Ownership History
Date
Name
Owned For
Owner Type
Purchase Details
Closed on
Jan 18, 2012
Sold by
Frizado Guitherme and Firzado Ruth
Bought by
Farias Liberia and Frizado Milton
Current Estimated Value
Purchase Details
Closed on
Sep 14, 1993
Sold by
Saintpierre Roger H and Saint Pierre Ruth R
Bought by
Frizado Guilherme A and Frizado Ruth S P
Home Financials for this Owner
Home Financials are based on the most recent Mortgage that was taken out on this home.
Original Mortgage
$112,000
Interest Rate
7.21%
Mortgage Type
Purchase Money Mortgage
Create a Home Valuation Report for This Property
The Home Valuation Report is an in-depth analysis detailing your home's value as well as a comparison with similar homes in the area
Home Values in the Area
Average Home Value in this Area
Purchase History
| Date | Buyer | Sale Price | Title Company |
|---|---|---|---|
| Farias Liberia | -- | -- | |
| Frizado Guilherme A | $132,000 | -- |
Source: Public Records
Mortgage History
| Date | Status | Borrower | Loan Amount |
|---|---|---|---|
| Previous Owner | Frizado Guilherme A | $112,000 |
Source: Public Records
Tax History Compared to Growth
Tax History
| Year | Tax Paid | Tax Assessment Tax Assessment Total Assessment is a certain percentage of the fair market value that is determined by local assessors to be the total taxable value of land and additions on the property. | Land | Improvement |
|---|---|---|---|---|
| 2025 | $4,433 | $387,200 | $137,700 | $249,500 |
| 2024 | $4,062 | $353,500 | $132,400 | $221,100 |
| 2023 | $3,671 | $299,200 | $118,800 | $180,400 |
| 2022 | $3,333 | $264,100 | $110,000 | $154,100 |
| 2021 | $3,607 | $260,800 | $103,900 | $156,900 |
| 2020 | $3,582 | $247,900 | $100,000 | $147,900 |
| 2019 | $3,610 | $247,600 | $100,000 | $147,600 |
| 2018 | $3,405 | $232,900 | $100,000 | $132,900 |
| 2017 | $3,195 | $228,200 | $100,000 | $128,200 |
| 2016 | $2,905 | $213,100 | $100,000 | $113,100 |
| 2015 | $2,744 | $209,800 | $93,500 | $116,300 |
| 2014 | $2,639 | $209,800 | $93,500 | $116,300 |
Source: Public Records
Map
Nearby Homes
- 44 Fenmore St
- 1796 Locust St
- 168 Windsor St
- 200 David St
- 235 Chavenson St
- 243 Oak Grove Ave
- 302 Oak Grove Ave
- 344 Beattie St Unit 5
- 380 Eddy St
- 350 Doherty St
- 36 Fordney St
- 14 Downing St
- 23 Lexington St
- 159 Covel St
- 89 Lafayette St
- 85 Reney St
- 83 Jencks St
- 34 Quequechan St
- 32 Quequechan St
- 88 Harrison St Unit 5