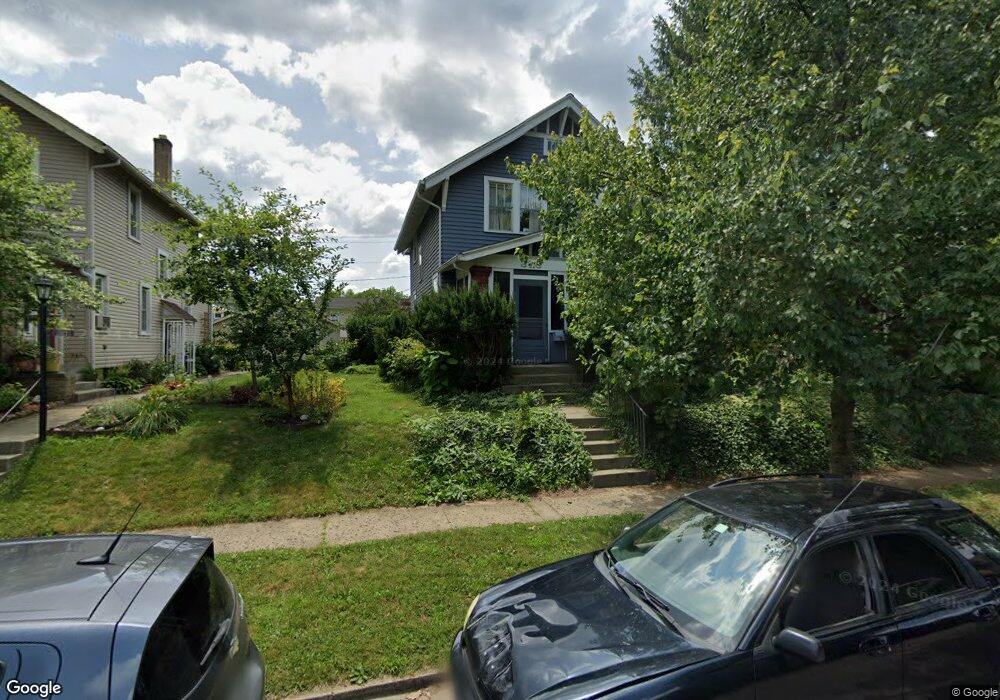
373 E Tulane Rd Columbus, OH 43202
Clintonville NeighborhoodEstimated Value: $400,000 - $445,000
3
Beds
2
Baths
1,620
Sq Ft
$260/Sq Ft
Est. Value
About This Home
This home is located at 373 E Tulane Rd, Columbus, OH 43202 and is currently estimated at $420,598, approximately $259 per square foot. 373 E Tulane Rd is a home located in Franklin County with nearby schools including Clinton Elementary School, Dominion Middle School, and Whetstone High School.
Ownership History
Date
Name
Owned For
Owner Type
Purchase Details
Closed on
Jul 19, 1988
Bought by
Jannazo Louis A
Current Estimated Value
Create a Home Valuation Report for This Property
The Home Valuation Report is an in-depth analysis detailing your home's value as well as a comparison with similar homes in the area
Home Values in the Area
Average Home Value in this Area
Purchase History
| Date | Buyer | Sale Price | Title Company |
|---|---|---|---|
| Jannazo Louis A | $74,600 | -- |
Source: Public Records
Tax History
| Year | Tax Paid | Tax Assessment Tax Assessment Total Assessment is a certain percentage of the fair market value that is determined by local assessors to be the total taxable value of land and additions on the property. | Land | Improvement |
|---|---|---|---|---|
| 2025 | $5,360 | $119,430 | $34,060 | $85,370 |
| 2024 | $5,360 | $119,430 | $34,060 | $85,370 |
| 2023 | $5,291 | $119,420 | $34,055 | $85,365 |
| 2022 | $5,277 | $101,750 | $25,170 | $76,580 |
| 2021 | $5,287 | $101,750 | $25,170 | $76,580 |
| 2020 | $5,293 | $101,750 | $25,170 | $76,580 |
| 2019 | $4,720 | $77,810 | $19,360 | $58,450 |
| 2018 | $4,381 | $77,810 | $19,360 | $58,450 |
| 2017 | $4,717 | $77,810 | $19,360 | $58,450 |
| 2016 | $4,463 | $67,380 | $18,690 | $48,690 |
| 2015 | $4,052 | $67,380 | $18,690 | $48,690 |
| 2014 | $4,062 | $67,380 | $18,690 | $48,690 |
| 2013 | $1,977 | $66,500 | $17,815 | $48,685 |
Source: Public Records
Map
Nearby Homes
- 415 E Weber Rd
- 2836-2838 Indianola Ave Unit 2836
- 2804 Indianola Ave
- 2771 Indianola Ave
- 2785 Kensington Place W
- 366 Parkview Dr Unit 366
- 521 Melrose Ave
- 555 E Weber Rd
- 2717 Hibbert Ave
- 580 Crestview Rd
- 415 Glen Echo Cir
- 296 Walhalla Rd
- 53 Olentangy St
- 109 E Arcadia Ave
- 2805 Beulah Rd
- 29 Crestview Rd
- 2733 Beulah Rd
- 2604 N 4th St
- 99 E Pacemont Rd
- 74 E Dodridge St
- 367 E Tulane Rd
- 377 E Tulane Rd
- 383 E Tulane Rd Unit 385
- 361 E Tulane Rd
- 368 Crestview Rd
- 364 Crestview Rd
- 355 E Tulane Rd
- 360 Crestview Rd
- 374 Crestview Rd
- 358 Crestview Rd
- 378 Crestview Rd
- 376-378 Crestview Rd
- 393 E Tulane Rd
- 376 E Tulane Rd
- 352 Crestview Rd
- 372 E Tulane Rd
- 382 E Tulane Rd
- 368 E Tulane Rd
- 386 E Tulane Rd
- 382 Crestview Rd
Your Personal Tour Guide
Ask me questions while you tour the home.