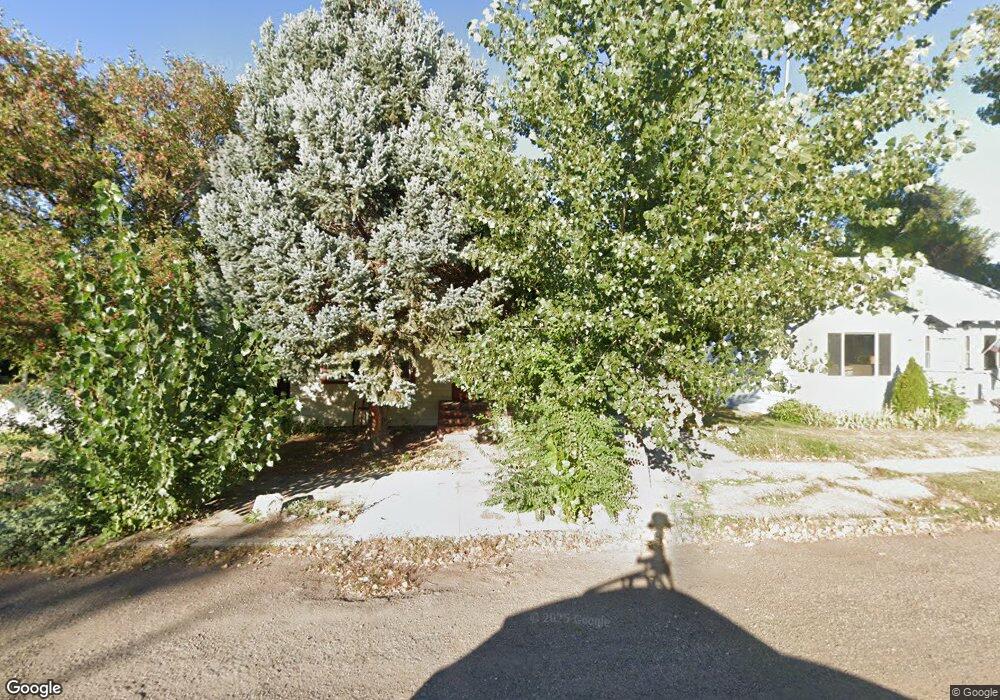
373 N 4th Ave Forsyth, MT 59327
Estimated Value: $129,000 - $146,000
2
Beds
1
Bath
1,508
Sq Ft
$93/Sq Ft
Est. Value
About This Home
This home is located at 373 N 4th Ave, Forsyth, MT 59327 and is currently estimated at $140,200, approximately $92 per square foot. 373 N 4th Ave is a home located in Rosebud County with nearby schools including Forsyth Elementary School, Forsyth Junior High School, and Forsyth High School.
Ownership History
Date
Name
Owned For
Owner Type
Purchase Details
Closed on
Apr 15, 2026
Sold by
Kenton Stradinger
Bought by
Smallwood Haley
Current Estimated Value
Home Financials for this Owner
Home Financials are based on the most recent Mortgage that was taken out on this home.
Original Mortgage
$85,000
Outstanding Balance
$85,000
Interest Rate
5.43%
Mortgage Type
Credit Line Revolving
Estimated Equity
$55,200
Purchase Details
Closed on
Jun 21, 2021
Sold by
Heberle Brandon E and Heberle Rachel E
Bought by
Stradinger Kenton
Home Financials for this Owner
Home Financials are based on the most recent Mortgage that was taken out on this home.
Original Mortgage
$83,417
Interest Rate
2.9%
Mortgage Type
FHA
Purchase Details
Closed on
Sep 17, 2012
Sold by
Celaya Ernest R
Bought by
The Celaya Revocable Living Trust
Create a Home Valuation Report for This Property
The Home Valuation Report is an in-depth analysis detailing your home's value as well as a comparison with similar homes in the area
Purchase History
We collect this data history from publicly available records. To have your information removed, we recommend requesting removal directly through your county’s website.
| Date | Buyer | Sale Price | Title Company |
|---|---|---|---|
| Smallwood Haley | -- | Flyings Title And Escrow Of Mo | |
| Stradinger Kenton | $84,251 | First American Title | |
| Stradinger Kenton | -- | First American Title Company | |
| The Celaya Revocable Living Trust | -- | -- |
Source: Public Records
Mortgage History
We collect this data history from publicly available records. To have your information removed, we recommend requesting removal directly through your county’s website.
| Date | Status | Borrower | Loan Amount |
|---|---|---|---|
| Open | Smallwood Haley | $85,000 | |
| Previous Owner | Stradinger Kenton | $83,417 |
Source: Public Records
Tax History
| Year | Tax Paid | Tax Assessment Tax Assessment Total Assessment is a certain percentage of the fair market value that is determined by local assessors to be the total taxable value of land and additions on the property. | Land | Improvement |
|---|---|---|---|---|
| 2025 | $1,140 | $116,100 | $0 | $0 |
| 2024 | $1,268 | $86,800 | $0 | $0 |
| 2023 | $1,159 | $86,800 | $0 | $0 |
| 2022 | $1,094 | $77,900 | $0 | $0 |
| 2021 | $1,048 | $77,900 | $0 | $0 |
| 2020 | $991 | $75,600 | $0 | $0 |
| 2019 | $975 | $75,600 | $0 | $0 |
| 2018 | $948 | $72,200 | $0 | $0 |
| 2017 | $918 | $72,200 | $0 | $0 |
| 2016 | $948 | $78,500 | $0 | $0 |
| 2015 | $715 | $78,500 | $0 | $0 |
| 2014 | $548 | $34,397 | $0 | $0 |
Source: Public Records
Map
Nearby Homes
- 1st 1st Ave W
- 172 N 9th Ave
- 209 S 7th Ave
- 242 N 13th Ave
- 214 N 13th Ave
- 509 N 13th Ave
- 1290 Front St
- 255 Smith Creek Rd
- 00 Rosebud Creek Rd
- TBD Vananda
- TBD Us-12 W
- 0 Nhn Lone Rock Canyon
- Nhn Lone Rock Canyon Lot: Sc-28
- NHN Lone Rock Canyon
- Lone Rock Canyon Ln
- TBD Lone Rock Canyon Ln Unit SC-25
- TBD Lone Rock Canyon Ln Unit SC-28
- 73 Snider Subdivision Rd
- nhn Lone Rock
- Little Porcupine Creek Rd
Your Personal Tour Guide
Ask me questions while you tour the home.