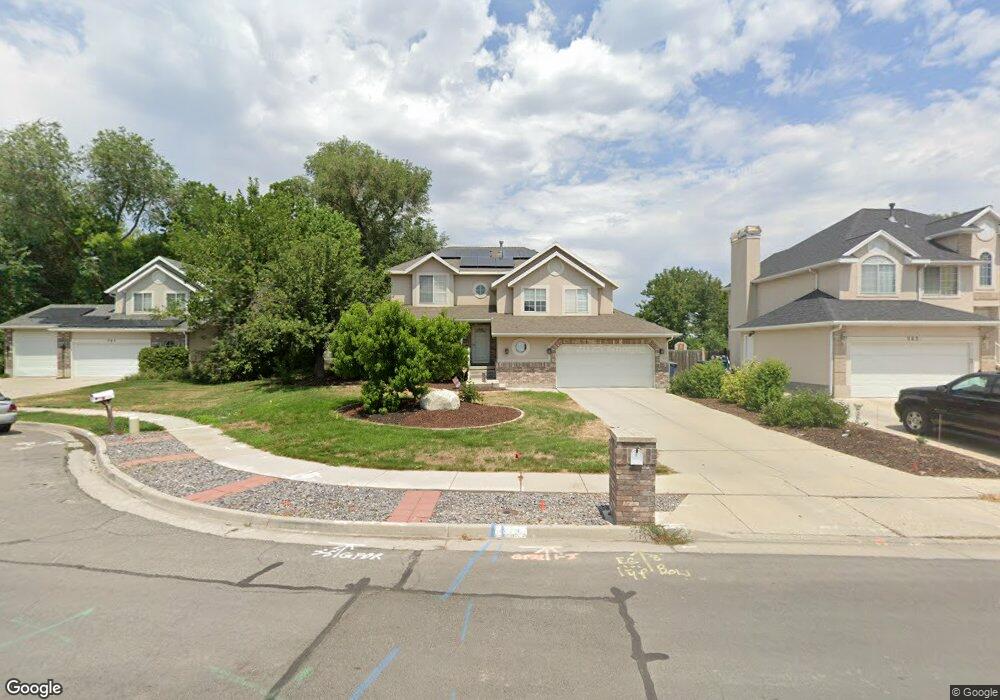
373 Sandy Park Cir Midvale, UT 84047
Estimated Value: $673,000 - $853,000
6
Beds
4
Baths
3,125
Sq Ft
$235/Sq Ft
Est. Value
About This Home
This home is located at 373 Sandy Park Cir, Midvale, UT 84047 and is currently estimated at $735,683, approximately $235 per square foot. 373 Sandy Park Cir is a home located in Salt Lake County with nearby schools including Midvalley Elementary School, Union Middle School, and Hillcrest High School.
Ownership History
Date
Name
Owned For
Owner Type
Purchase Details
Closed on
May 2, 2013
Sold by
M & H Real Estate Investments Inc
Bought by
Schoening Eric and Schoening Anna
Current Estimated Value
Home Financials for this Owner
Home Financials are based on the most recent Mortgage that was taken out on this home.
Original Mortgage
$239,925
Outstanding Balance
$170,242
Interest Rate
3.51%
Mortgage Type
New Conventional
Estimated Equity
$565,441
Purchase Details
Closed on
Mar 5, 2013
Sold by
Hernandez Arthur L
Bought by
M & H Real Estate Investments Inc
Home Financials for this Owner
Home Financials are based on the most recent Mortgage that was taken out on this home.
Original Mortgage
$239,925
Outstanding Balance
$170,242
Interest Rate
3.51%
Mortgage Type
New Conventional
Estimated Equity
$565,441
Purchase Details
Closed on
Jul 26, 2006
Sold by
Prudential Relocation Inc
Bought by
Hernandez Arthur L
Home Financials for this Owner
Home Financials are based on the most recent Mortgage that was taken out on this home.
Original Mortgage
$355,482
Interest Rate
6.57%
Mortgage Type
VA
Purchase Details
Closed on
May 31, 2006
Sold by
Chen Zumao and Niu Liping
Bought by
Prudential Relocation Inc
Home Financials for this Owner
Home Financials are based on the most recent Mortgage that was taken out on this home.
Original Mortgage
$355,482
Interest Rate
6.57%
Mortgage Type
VA
Purchase Details
Closed on
Mar 14, 2002
Sold by
Chen Zumao
Bought by
Chen Zumao and Niu Liping
Home Financials for this Owner
Home Financials are based on the most recent Mortgage that was taken out on this home.
Original Mortgage
$184,800
Interest Rate
6.49%
Purchase Details
Closed on
Jan 14, 2002
Sold by
Hein Jason D and Hein Carol L
Bought by
Cendant Mobility Financial Corp
Home Financials for this Owner
Home Financials are based on the most recent Mortgage that was taken out on this home.
Original Mortgage
$184,800
Interest Rate
6.49%
Purchase Details
Closed on
Jan 18, 2001
Sold by
Oredson Gregory N and Oredson Sherri L
Bought by
Hein Jason D and Hein Carol L
Purchase Details
Closed on
Jun 1, 1998
Sold by
Oredson Gregory N and Oredson Sherri Lynn
Bought by
Oredson Gregory N and Oredson Sherri L
Home Financials for this Owner
Home Financials are based on the most recent Mortgage that was taken out on this home.
Original Mortgage
$185,000
Interest Rate
7.1%
Purchase Details
Closed on
Dec 28, 1995
Sold by
Ivory Homes
Bought by
Oredson Gregory N and Oredson Sherri Lynn
Home Financials for this Owner
Home Financials are based on the most recent Mortgage that was taken out on this home.
Original Mortgage
$147,000
Interest Rate
7.37%
Create a Home Valuation Report for This Property
The Home Valuation Report is an in-depth analysis detailing your home's value as well as a comparison with similar homes in the area
Home Values in the Area
Average Home Value in this Area
Purchase History
| Date | Buyer | Sale Price | Title Company |
|---|---|---|---|
| Schoening Eric | -- | 1St Liberty Title Lc | |
| M & H Real Estate Investments Inc | $253,100 | None Available | |
| Hernandez Arthur L | -- | Backman Title Services | |
| Prudential Relocation Inc | -- | Backman Title Services | |
| Chen Zumao | -- | Equity Title | |
| Chenna Zumao | -- | Equity Title | |
| Cendant Mobility Financial Corp | -- | Equity Title | |
| Hein Jason D | -- | Legacy Land Title | |
| Oredson Gregory N | -- | -- | |
| Oredson Gregory N | -- | -- |
Source: Public Records
Mortgage History
| Date | Status | Borrower | Loan Amount |
|---|---|---|---|
| Open | Schoening Eric | $239,925 | |
| Previous Owner | Hernandez Arthur L | $355,482 | |
| Previous Owner | Chenna Zumao | $184,800 | |
| Previous Owner | Oredson Gregory N | $185,000 | |
| Previous Owner | Oredson Gregory N | $147,000 |
Source: Public Records
Tax History
| Year | Tax Paid | Tax Assessment Tax Assessment Total Assessment is a certain percentage of the fair market value that is determined by local assessors to be the total taxable value of land and additions on the property. | Land | Improvement |
|---|---|---|---|---|
| 2025 | $3,575 | $659,400 | $175,300 | $484,100 |
| 2024 | $3,575 | $660,300 | $159,400 | $500,900 |
| 2023 | $3,198 | $589,100 | $151,500 | $437,600 |
| 2022 | $3,321 | $598,200 | $148,500 | $449,700 |
| 2021 | $2,928 | $448,100 | $140,600 | $307,500 |
| 2020 | $2,789 | $402,800 | $122,800 | $280,000 |
| 2019 | $2,929 | $412,000 | $115,800 | $296,200 |
| 2018 | $2,752 | $403,600 | $115,800 | $287,800 |
| 2017 | $2,676 | $374,700 | $115,800 | $258,900 |
| 2016 | $2,808 | $369,700 | $115,800 | $253,900 |
| 2015 | $2,701 | $329,800 | $126,000 | $203,800 |
| 2014 | $2,660 | $314,900 | $122,200 | $192,700 |
Source: Public Records
Map
Nearby Homes
- 354 E 7635 South St
- 350 E 7635 South St
- 7613 S 300 E
- 330 E 7635 S Unit 344
- 314 E Woodscape Way S
- 489 E 7800 S Unit 2
- 392 W Chadam Way S Unit 62
- 7342 S Seven Tree Ln W Unit 77
- 7337 S Seven Tree Ln W Unit 82
- 386 W Chadam Way S Unit 64
- 7343 S Seven Tree Ln Unit 79
- 388 W Chadam Way S Unit 63
- 220 E Greenwood Ave
- 397 E Tractor Dr
- 7824 S 280 E
- 7738 S Sunbird Way
- 7309 S Union Village Cir
- 7914 S Harvel Dr
- 687 E Orchard Vista Ct
- 379 E Horse Creek Dr
- 373 E Sandy Park Cir
- 383 Sandy Park Cir
- 365 Sandy Park Cir
- 376 Sandy Woods Ln
- 386 Sandy Woods Ln
- 364 E Sandy Woods Ln
- 364 Sandy Woods Ln
- 393 Sandy Park Cir
- 357 E Sandy Park Cir
- 357 Sandy Park Cir
- 403 Sandy Park Cir
- 396 E Sandy Woods Ln
- 396 Sandy Woods Ln
- 374 E Sandy Park Cir
- 396 E Sandy Woods Ln
- 352 Sandy Woods Ln
- 352 E Sandy Woods Ln
- 374 Sandy Park Cir
- 374 E Sandy Park Cir
- 351 E Sandy Park Cir
Your Personal Tour Guide
Ask me questions while you tour the home.