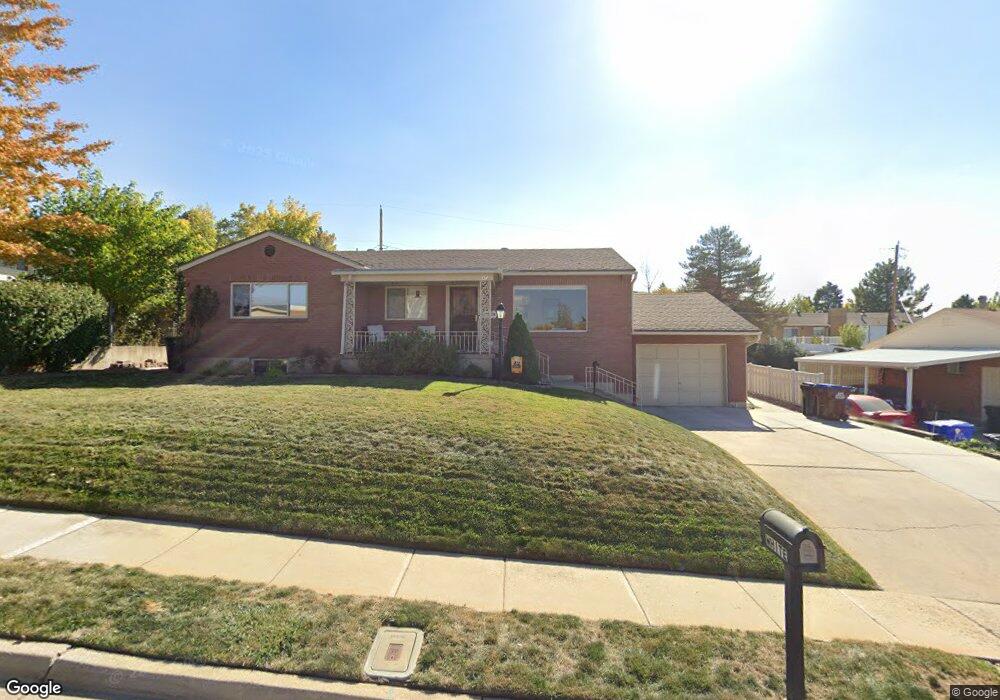
373 W 3500 S Bountiful, UT 84010
Estimated Value: $503,000 - $523,000
3
Beds
2
Baths
1,172
Sq Ft
$439/Sq Ft
Est. Value
About This Home
This home is located at 373 W 3500 S, Bountiful, UT 84010 and is currently estimated at $514,449, approximately $438 per square foot. 373 W 3500 S is a home located in Davis County with nearby schools including Adelaide School, South Davis Junior High School, and Woods Cross High School.
Ownership History
Date
Name
Owned For
Owner Type
Purchase Details
Closed on
Nov 19, 2020
Sold by
Anderson Heather W
Bought by
Anderson Heather W and The Heather W Anderson Trust
Current Estimated Value
Purchase Details
Closed on
Jul 31, 2019
Sold by
Anderson Heather W and Heather W Anderson Trust
Bought by
Anderson Heather W
Purchase Details
Closed on
Mar 27, 2019
Sold by
Wren Melany and Morrill Sharlene
Bought by
Anderson Heather Ann
Home Financials for this Owner
Home Financials are based on the most recent Mortgage that was taken out on this home.
Original Mortgage
$160,000
Outstanding Balance
$140,381
Interest Rate
4.3%
Mortgage Type
New Conventional
Estimated Equity
$374,068
Purchase Details
Closed on
Jul 6, 2011
Sold by
White Gertrude O and White Gertrude V
Bought by
The Gertrude O White Trust and White Gertrude O
Create a Home Valuation Report for This Property
The Home Valuation Report is an in-depth analysis detailing your home's value as well as a comparison with similar homes in the area
Purchase History
| Date | Buyer | Sale Price | Title Company |
|---|---|---|---|
| Anderson Heather W | -- | Rudd & Hawkers Ttl Ins Agcy | |
| Anderson Heather W | -- | Rudd & Hawkes Ttl Ins Agcy L | |
| Anderson Heather W | -- | None Available | |
| Anderson Heather Ann | -- | Rudd & Hawkes Ttl Ins Agcy L | |
| The Gertrude O White Trust | -- | None Available |
Source: Public Records
Mortgage History
| Date | Status | Borrower | Loan Amount |
|---|---|---|---|
| Open | Anderson Heather Ann | $160,000 |
Source: Public Records
Tax History
| Year | Tax Paid | Tax Assessment Tax Assessment Total Assessment is a certain percentage of the fair market value that is determined by local assessors to be the total taxable value of land and additions on the property. | Land | Improvement |
|---|---|---|---|---|
| 2025 | $2,810 | $255,750 | $136,186 | $119,564 |
| 2024 | $2,676 | $247,500 | $122,861 | $124,639 |
| 2023 | $2,584 | $431,000 | $224,976 | $206,024 |
| 2022 | $2,634 | $246,950 | $122,564 | $124,386 |
| 2021 | $2,255 | $323,000 | $160,449 | $162,551 |
| 2020 | $2,039 | $293,000 | $136,556 | $156,444 |
| 2019 | $2,000 | $284,000 | $140,843 | $143,157 |
| 2018 | $1,867 | $261,000 | $137,984 | $123,016 |
| 2016 | $1,496 | $119,570 | $44,593 | $74,977 |
| 2015 | $1,464 | $110,660 | $44,593 | $66,067 |
| 2014 | $1,551 | $119,926 | $44,593 | $75,333 |
| 2013 | -- | $90,033 | $41,774 | $48,259 |
Source: Public Records
Map
Nearby Homes
- 336 W 3500 S
- 3279 Plum Tree Ln
- 468 W 3200 S
- 294 Springridge Dr
- 527 Applewood Dr
- 310 N 675 E
- 652 W 3600 S
- 3285 S Davis Blvd
- 337 W 2900 S
- 678 W 3200 S
- 8 E 3500 S
- 178 N Valley View Dr
- 90 Scenic Hills Cir
- 552 W 2900 S
- 554 W 2900 S
- 136 E Fairway Dr
- 544 W 2900 S
- 558 Eastpointe Cir
- 3716 S Oakridge Cir
- 53 N Foxhill Rd
Your Personal Tour Guide
Ask me questions while you tour the home.