Estimated Value: $94,500
3
Beds
1
Bath
1,091
Sq Ft
$87/Sq Ft
Est. Value
About This Home
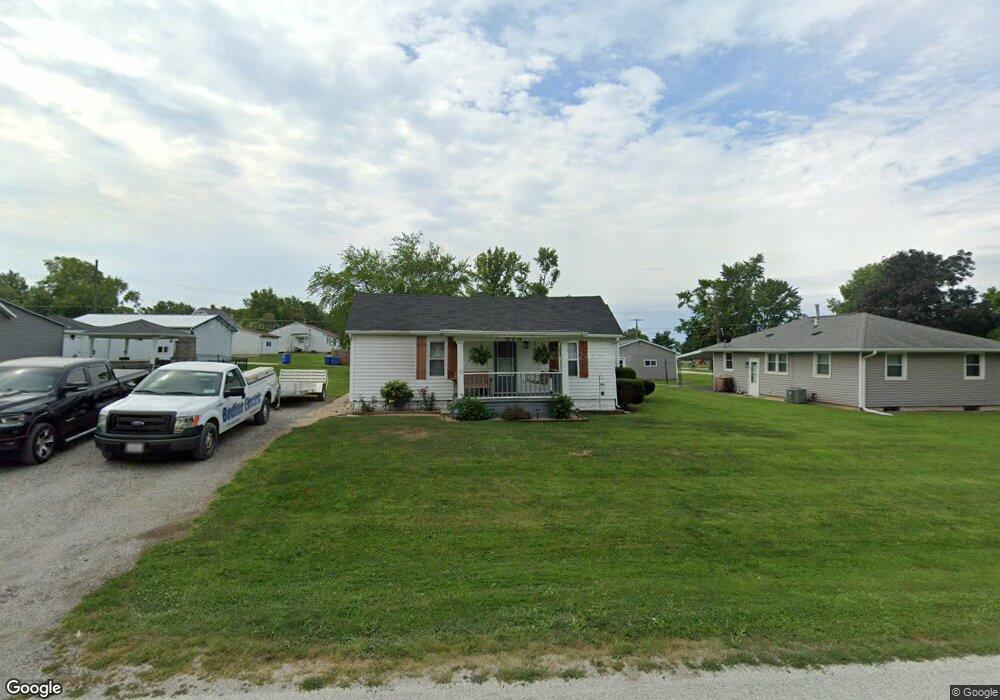
This home is located at 373 W Dunn St, Macon, IL 62544 and is currently priced at $94,500, approximately $86 per square foot. 373 W Dunn St is a home located in Macon County with nearby schools including Meridian Middle School and Meridian High School.
Ownership History
Date
Name
Owned For
Owner Type
Purchase Details
Closed on
Jun 24, 2022
Sold by
Wilson Cliff D
Bought by
Shartzer Brian F and Shartzer Vicki L
Current Estimated Value
Purchase Details
Closed on
Mar 6, 2020
Sold by
Scott Terry L and Scott Mary A
Bought by
Wilson Cliff D
Purchase Details
Closed on
Nov 4, 2013
Sold by
Griggs Melissa D
Bought by
Scott Terry L and Scott Mary A
Home Financials for this Owner
Home Financials are based on the most recent Mortgage that was taken out on this home.
Original Mortgage
$30,000
Interest Rate
4.5%
Mortgage Type
Future Advance Clause Open End Mortgage
Purchase Details
Closed on
Jun 19, 2008
Sold by
Wallace Raymond and Wallace Loretta Louise
Bought by
Griggs Melissa D
Home Financials for this Owner
Home Financials are based on the most recent Mortgage that was taken out on this home.
Original Mortgage
$41,836
Interest Rate
6.04%
Mortgage Type
New Conventional
Create a Home Valuation Report for This Property
The Home Valuation Report is an in-depth analysis detailing your home's value as well as a comparison with similar homes in the area
Home Values in the Area
Average Home Value in this Area
Purchase History
| Date | Buyer | Sale Price | Title Company |
|---|---|---|---|
| Shartzer Brian F | -- | None Listed On Document | |
| Shartzer Brian F | -- | None Listed On Document | |
| Wilson Cliff D | $23,000 | None Available | |
| Scott Terry L | $43,000 | None Available | |
| Griggs Melissa D | $41,000 | None Available |
Source: Public Records
Mortgage History
| Date | Status | Borrower | Loan Amount |
|---|---|---|---|
| Previous Owner | Scott Terry L | $30,000 | |
| Previous Owner | Griggs Melissa D | $41,836 |
Source: Public Records
Tax History Compared to Growth
Tax History
| Year | Tax Paid | Tax Assessment Tax Assessment Total Assessment is a certain percentage of the fair market value that is determined by local assessors to be the total taxable value of land and additions on the property. | Land | Improvement |
|---|---|---|---|---|
| 2023 | $0 | $0 | $0 | $0 |
| 2022 | $1,295 | $22,230 | $4,938 | $17,292 |
| 2021 | $1,254 | $21,116 | $4,691 | $16,425 |
| 2020 | $1,737 | $19,898 | $4,420 | $15,478 |
| 2019 | $1,737 | $19,898 | $4,420 | $15,478 |
| 2018 | $1,701 | $19,426 | $4,315 | $15,111 |
| 2017 | $1,703 | $19,508 | $4,333 | $15,175 |
| 2016 | $1,753 | $19,485 | $4,328 | $15,157 |
| 2015 | $1,686 | $18,918 | $4,202 | $14,716 |
| 2014 | $1,599 | $18,730 | $4,160 | $14,570 |
| 2013 | $1,108 | $18,730 | $4,160 | $14,570 |
Source: Public Records
Map
Nearby Homes
- 275 W Cole St
- 161 N Front St
- 206 W Andrews St
- 124 Robin Dr
- 501 W Walker Rd Unit Macon Illinois 62544
- Lot 13 Galeana Dr
- Lot 52 Galeana Dr
- Lot 12 Galeana Dr
- Lot 51 Galeana Dr
- Lot 50 Galeana Dr
- Lot 5 Galena Dr
- Lot 6 Galena Dr
- Lot 7 Galena Dr
- Lot 8 Galena Dr
- Lot 10 Galena Dr
- Lot 11 Galeana Dr
- Lot 9 Galeana Dr
- Lot 49 Galeana Dr
- Lot 14 Lakelaine Dr
- Lot 15 Lakelaine Dr
- 359 W Dunn St
- 345 W Dunn St
- 110 S Towson
- 388 W Dunn St
- 356 W Dunn St
- 327 W Dunn St
- 364 W Eckhardt St
- 415 W Dunn St
- 356 W Eckhardt St
- 396 W Eckhardt St
- 342 W Eckhardt St
- 303 W Dunn St
- 304 W Dunn St
- 330 W Eckhardt St
- 137 S Shaw St
- 159 S Towson
- 385 W Cole St
- 355 W Cole St
- 170 N Towson St
- 404 W Eckhardt St