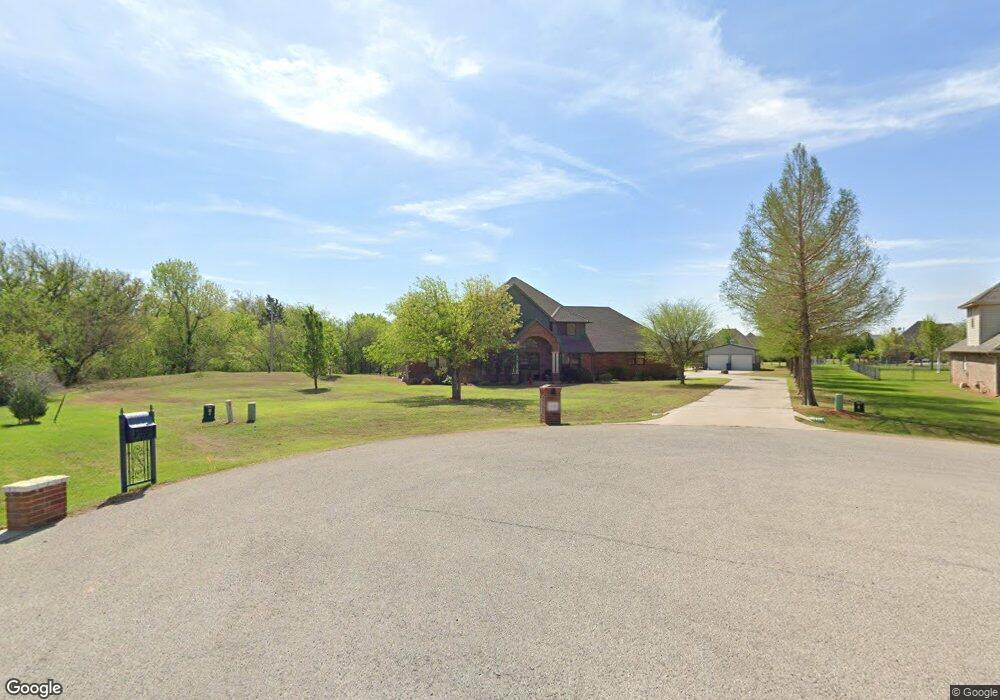
3730 Deerbrook Cir NE Piedmont, OK 73078
Estimated Value: $526,000 - $563,000
4
Beds
3
Baths
2,679
Sq Ft
$204/Sq Ft
Est. Value
About This Home
This home is located at 3730 Deerbrook Cir NE, Piedmont, OK 73078 and is currently estimated at $545,932, approximately $203 per square foot. 3730 Deerbrook Cir NE is a home located in Canadian County with nearby schools including Stone Ridge Elementary School, Piedmont Intermediate Elementary School, and Piedmont Middle School.
Ownership History
Date
Name
Owned For
Owner Type
Purchase Details
Closed on
Oct 24, 2018
Sold by
Copeland John William and Copeland Kristina Mary
Bought by
Ruark Sean E and Ruark Maghan A
Current Estimated Value
Home Financials for this Owner
Home Financials are based on the most recent Mortgage that was taken out on this home.
Original Mortgage
$340,100
Outstanding Balance
$297,219
Interest Rate
4.6%
Mortgage Type
New Conventional
Estimated Equity
$248,713
Purchase Details
Closed on
Aug 11, 2005
Sold by
Phil Boevers Enterprises Inc
Bought by
Copeland John William and Copeland Kristina Mary
Home Financials for this Owner
Home Financials are based on the most recent Mortgage that was taken out on this home.
Original Mortgage
$243,000
Interest Rate
5.51%
Mortgage Type
New Conventional
Purchase Details
Closed on
Nov 11, 2004
Sold by
Coyoteee Springs Llc
Create a Home Valuation Report for This Property
The Home Valuation Report is an in-depth analysis detailing your home's value as well as a comparison with similar homes in the area
Home Values in the Area
Average Home Value in this Area
Purchase History
| Date | Buyer | Sale Price | Title Company |
|---|---|---|---|
| Ruark Sean E | $358,000 | First American Title | |
| Copeland John William | $192,000 | None Available | |
| -- | -- | -- |
Source: Public Records
Mortgage History
| Date | Status | Borrower | Loan Amount |
|---|---|---|---|
| Open | Ruark Sean E | $340,100 | |
| Previous Owner | Copeland John William | $243,000 |
Source: Public Records
Tax History Compared to Growth
Tax History
| Year | Tax Paid | Tax Assessment Tax Assessment Total Assessment is a certain percentage of the fair market value that is determined by local assessors to be the total taxable value of land and additions on the property. | Land | Improvement |
|---|---|---|---|---|
| 2024 | $4,087 | $40,642 | $4,200 | $36,442 |
| 2023 | $4,087 | $39,458 | $4,200 | $35,258 |
| 2022 | $4,003 | $38,309 | $4,200 | $34,109 |
| 2021 | $4,024 | $37,193 | $4,200 | $32,993 |
| 2020 | $3,971 | $36,110 | $4,200 | $31,910 |
| 2019 | $3,810 | $36,448 | $4,200 | $32,248 |
| 2018 | $3,589 | $33,966 | $4,200 | $29,766 |
| 2017 | $3,575 | $33,966 | $4,200 | $29,766 |
| 2016 | $3,412 | $34,041 | $4,200 | $29,841 |
| 2015 | -- | $32,629 | $4,200 | $28,429 |
| 2014 | -- | $31,679 | $4,200 | $27,479 |
Source: Public Records
Map
Nearby Homes
- 4162 Hawthorne St
- 3117 Turkey Creek Ln NE
- 4144 Reta Cir
- 664 Paris Ave
- 4095 Richards Way
- 0 Edmond Rd NE
- 722 Venetian Ave
- 546 Paris Ave
- 4094 Richards Way
- 478 Paris Ave
- 444 Paris Ave
- 664 Venetian Ave
- 545 Venetian Ave
- Plan 2630 at Magnolia Meadows II
- Plan 2680 Front at Magnolia Meadows II
- Plan 2640 at Magnolia Meadows II
- Plan 2670 at Magnolia Meadows II
- Plan 2675 at Magnolia Meadows II
- Plan 2732+ at Magnolia Meadows II
- Plan 2732 at Magnolia Meadows II
- 3730 Deerbrook Cir NE
- 3730 Deerbrook Cir NE
- 3640 Deerbrook Cir
- 3685 Deer Brook Trail
- 3685 Deer Brook Trail
- 3639 Deerbrook Cir
- 3775 Deer Brook Trail
- 3687 Coyote Run
- 3815 Deer Brook Trail
- 3815 Deer Brook Trail
- 3815 Deer Brook Trail
- 3628 Coyote Run
- 3565 Coyote
- 3750 Deer Brook Trail
- 3694 Deer Brook Trail
- 3688 Coyote Run
- 3517 Coyote Run
- 3517 Coyote Run
- 3775 Coyote Run
- 3800 Deer Brook Trail