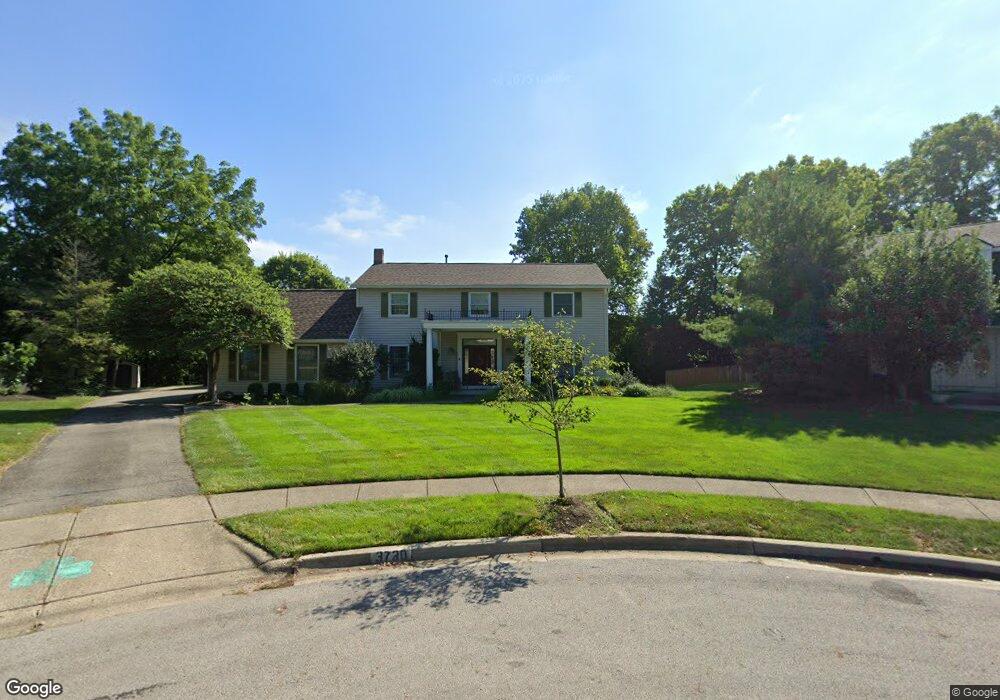
3730 Kennybrook Bluff Columbus, OH 43220
Estimated Value: $719,000 - $896,000
4
Beds
4
Baths
3,106
Sq Ft
$266/Sq Ft
Est. Value
About This Home
This home is located at 3730 Kennybrook Bluff, Columbus, OH 43220 and is currently estimated at $826,411, approximately $266 per square foot. 3730 Kennybrook Bluff is a home located in Franklin County with nearby schools including Greensview Elementary School, Hastings Middle School, and Upper Arlington High School.
Ownership History
Date
Name
Owned For
Owner Type
Purchase Details
Closed on
Feb 23, 2012
Sold by
Diorio Douglas J
Bought by
Diorio Mary S
Current Estimated Value
Purchase Details
Closed on
Apr 10, 2001
Sold by
Glatz Michael A and Glatz Jayne L
Bought by
Diorio Douglas J and Diorio Mary S
Home Financials for this Owner
Home Financials are based on the most recent Mortgage that was taken out on this home.
Original Mortgage
$240,000
Outstanding Balance
$88,671
Interest Rate
7.05%
Estimated Equity
$737,740
Purchase Details
Closed on
Dec 4, 1998
Sold by
Marquard Jeanne L
Bought by
Glatz Michael A and Glatz Jayne L
Home Financials for this Owner
Home Financials are based on the most recent Mortgage that was taken out on this home.
Original Mortgage
$227,150
Interest Rate
6.8%
Purchase Details
Closed on
Jul 6, 1997
Sold by
Estate Of James Marquard
Bought by
Marquard Jeanne
Purchase Details
Closed on
Jul 1, 1985
Purchase Details
Closed on
May 1, 1977
Create a Home Valuation Report for This Property
The Home Valuation Report is an in-depth analysis detailing your home's value as well as a comparison with similar homes in the area
Home Values in the Area
Average Home Value in this Area
Purchase History
| Date | Buyer | Sale Price | Title Company |
|---|---|---|---|
| Diorio Mary S | -- | Bxtalon | |
| Diorio Douglas J | $316,000 | Chicago Title | |
| Glatz Michael A | $285,000 | Chicago Title | |
| Marquard Jeanne | -- | -- | |
| -- | $153,900 | -- | |
| -- | $92,000 | -- |
Source: Public Records
Mortgage History
| Date | Status | Borrower | Loan Amount |
|---|---|---|---|
| Open | Diorio Douglas J | $240,000 | |
| Closed | Glatz Michael A | $227,150 |
Source: Public Records
Tax History Compared to Growth
Tax History
| Year | Tax Paid | Tax Assessment Tax Assessment Total Assessment is a certain percentage of the fair market value that is determined by local assessors to be the total taxable value of land and additions on the property. | Land | Improvement |
|---|---|---|---|---|
| 2024 | $13,509 | $230,060 | $74,380 | $155,680 |
| 2023 | $13,154 | $230,055 | $74,375 | $155,680 |
| 2022 | $14,129 | $202,200 | $63,000 | $139,200 |
| 2021 | $12,508 | $202,200 | $63,000 | $139,200 |
| 2020 | $12,397 | $202,200 | $63,000 | $139,200 |
| 2019 | $11,514 | $166,040 | $63,000 | $103,040 |
| 2018 | $10,545 | $166,040 | $63,000 | $103,040 |
| 2017 | $11,425 | $166,040 | $63,000 | $103,040 |
| 2016 | $9,651 | $145,960 | $39,100 | $106,860 |
| 2015 | $9,642 | $145,960 | $39,100 | $106,860 |
| 2014 | $9,653 | $145,960 | $39,100 | $106,860 |
| 2013 | $4,925 | $141,750 | $35,525 | $106,225 |
Source: Public Records
Map
Nearby Homes
- 1109 Millcreek Ln
- 1206 Kenbrook Hills Dr
- 1059 Lambeth Dr
- 1016 Lambeth Dr
- 3526 Rue de Fleur Unit B18U
- 1315 La Rochelle Dr Unit B2U
- 1311 La Rochelle Dr Unit B2L
- 1121 Afton Rd
- 1310 Stoneygate Ln
- 1060 Woodmere Rd
- 745 Highland Dr
- 3311 Mansion Way
- 718 Highland Dr
- 1225 Brittany Ln
- 1560 Pemberton Dr
- 1098 Stanhope Dr
- 4319 Kenmont Place
- 4200 Rudy Rd
- 4070 Lyon Dr
- 1360 Langston Dr
- 3721 Kennybrook Bluff
- 3720 Kennybrook Bluff
- 3711 Kennybrook Bluff
- 3710 Kennybrook Bluff
- 3670 Kennybrook Bluff
- 1116 Kenbrook Common St
- 1121 Millcreek Ln
- 1130 Kenbrook Common St
- 3705 Kennybrook Bluff
- 1133 Millcreek Ln
- 1055 Birchmont Rd
- 3691 Kennybrook Bluff
- 3756 Criswell Dr
- 3681 Kennybrook Bluff
- 1047 Birchmont Rd
- 3641 Clearview Ave
- 1150 Kenbrook Common St
- 3721 Lindhurst Rd
- 3671 Kennybrook Bluff