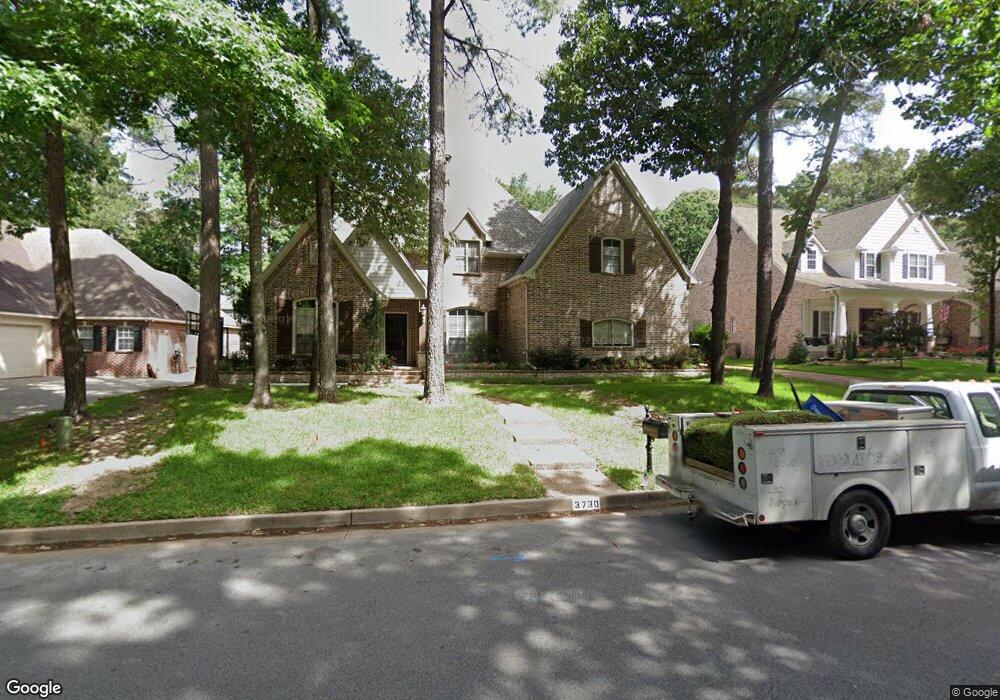
3730 Woods Blvd Tyler, TX 75707
The Woods NeighborhoodEstimated Value: $767,000 - $1,170,000
5
Beds
5
Baths
5,021
Sq Ft
$184/Sq Ft
Est. Value
About This Home
This home is located at 3730 Woods Blvd, Tyler, TX 75707 and is currently estimated at $925,530, approximately $184 per square foot. 3730 Woods Blvd is a home located in Smith County with nearby schools including Kissam Intermediate School, Jackson Elementary School, and Chapel Hill Middle School.
Ownership History
Date
Name
Owned For
Owner Type
Purchase Details
Closed on
Jul 5, 2019
Sold by
First Baptist Church Of Tyler Texas
Bought by
Wages Brent Todd and Wages Misty Clinton
Current Estimated Value
Purchase Details
Closed on
Mar 7, 2016
Sold by
Sumpter Brett A and Sumpter Missy R
Bought by
Wages Brent T and Wages Misty C
Home Financials for this Owner
Home Financials are based on the most recent Mortgage that was taken out on this home.
Original Mortgage
$417,000
Interest Rate
3.79%
Mortgage Type
New Conventional
Purchase Details
Closed on
Sep 1, 2011
Sold by
Federal Home Loan Mortgage Corporation
Bought by
Sumpter Brett A and Sumpter Missy R
Home Financials for this Owner
Home Financials are based on the most recent Mortgage that was taken out on this home.
Original Mortgage
$270,000
Interest Rate
4.28%
Mortgage Type
New Conventional
Purchase Details
Closed on
Nov 18, 2005
Sold by
Robinson Gregory Ray
Bought by
Bruce Beth Anne and Robinson Beth Anne
Create a Home Valuation Report for This Property
The Home Valuation Report is an in-depth analysis detailing your home's value as well as a comparison with similar homes in the area
Home Values in the Area
Average Home Value in this Area
Purchase History
| Date | Buyer | Sale Price | Title Company |
|---|---|---|---|
| Wages Brent Todd | -- | None Available | |
| Wages Brent T | -- | None Available | |
| Sumpter Brett A | -- | Servicelink | |
| Bruce Beth Anne | -- | None Available |
Source: Public Records
Mortgage History
| Date | Status | Borrower | Loan Amount |
|---|---|---|---|
| Previous Owner | Wages Brent T | $417,000 | |
| Previous Owner | Sumpter Brett A | $270,000 |
Source: Public Records
Tax History Compared to Growth
Tax History
| Year | Tax Paid | Tax Assessment Tax Assessment Total Assessment is a certain percentage of the fair market value that is determined by local assessors to be the total taxable value of land and additions on the property. | Land | Improvement |
|---|---|---|---|---|
| 2025 | $12,014 | $872,885 | $82,616 | $790,269 |
| 2024 | $12,014 | $702,878 | $82,616 | $790,269 |
| 2023 | $12,066 | $872,885 | $82,616 | $790,269 |
| 2022 | $10,458 | $580,891 | $61,686 | $519,205 |
| 2021 | $10,569 | $558,347 | $61,686 | $496,661 |
| 2020 | $10,936 | $560,602 | $58,932 | $501,670 |
| 2019 | $11,698 | $581,494 | $55,077 | $526,417 |
| 2018 | $11,629 | $581,494 | $55,077 | $526,417 |
| 2017 | $11,629 | $581,494 | $55,077 | $526,417 |
| 2016 | $10,633 | $531,682 | $55,077 | $476,605 |
| 2015 | $10,234 | $522,866 | $55,077 | $467,789 |
| 2014 | $10,234 | $512,982 | $55,077 | $457,905 |
Source: Public Records
Map
Nearby Homes
- 3858 Broadmoore Ct
- 3814 Brighton Creek Cir
- 3889 Brighton Creek Cir
- 3618 Trailwood Ct
- 3606 Trailwood Ct
- 3617 Flagstone Dr
- 4031 Stonebrook Ln
- 4008 Pinecreek Dr
- 3516 Cabot Ln
- 3409 Pebblebrook Dr
- 3621 Rock Creek Dr
- 3308 Moss Glen
- 3406 Pebblebrook Dr
- 4322 Madera Dr
- 4133 Colina Trail
- 4215 Chapel Quarters
- 3312 Storey Lake Dr
- 3507 Chapel View
- 3515 Chapel View
- 3515 & 3507 Chapel View
- 3730 3730 Woods Blvd
- 3734 3734 Woods Blvd
- 3734 Woods Blvd
- 3726 Woods Blvd
- 3726 3726 Woods Blvd
- 3646 Canyon Creek Cir
- 3642 Canyon Creek Cir
- 3738 Woods Blvd
- 3722 Woods Blvd
- 3729 Woods Blvd
- 3725 Woods Blvd
- 3725 3725 Woods Blvd
- 3650 Canyon Creek Cir
- 3721 Woods Blvd
- 3718 Woods Blvd
- 3638 Canyon Creek Cir
- 3654 Canyon Creek Cir
- 3802 Woods Blvd
- 3717 Woods Blvd
- 3627 Canyon Creek Cir