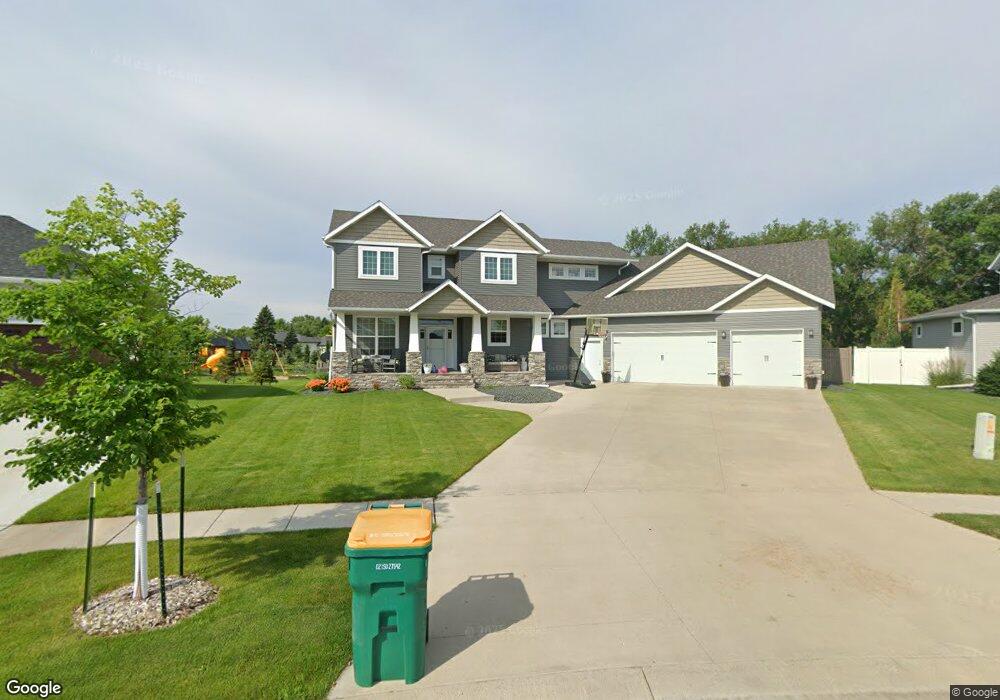
3732 Houkom Dr E West Fargo, ND 58078
Shadow Wood-Shadow Creek NeighborhoodEstimated Value: $823,000 - $901,000
5
Beds
4
Baths
4,672
Sq Ft
$187/Sq Ft
Est. Value
About This Home
This home is located at 3732 Houkom Dr E, West Fargo, ND 58078 and is currently estimated at $871,742, approximately $186 per square foot. 3732 Houkom Dr E is a home located in Cass County with nearby schools including Aurora Elementary School, Liberty Middle School, and West Fargo Sheyenne High School.
Ownership History
Date
Name
Owned For
Owner Type
Purchase Details
Closed on
Jul 12, 2019
Sold by
Asplund Nathan M and Nessi Asplund Maria C
Bought by
Solheim Andy and Solheim Melissa
Current Estimated Value
Home Financials for this Owner
Home Financials are based on the most recent Mortgage that was taken out on this home.
Original Mortgage
$520,000
Outstanding Balance
$448,650
Interest Rate
3.82%
Mortgage Type
New Conventional
Estimated Equity
$423,092
Purchase Details
Closed on
Aug 20, 2015
Sold by
Titan Homes Inc
Bought by
Asplund Nathan M and Nessi Asplund Maria C
Home Financials for this Owner
Home Financials are based on the most recent Mortgage that was taken out on this home.
Original Mortgage
$417,000
Interest Rate
4.03%
Mortgage Type
New Conventional
Purchase Details
Closed on
Mar 10, 2015
Sold by
Shadow Creek Development Iii Llc
Bought by
Titan Homes Inc
Home Financials for this Owner
Home Financials are based on the most recent Mortgage that was taken out on this home.
Original Mortgage
$245,000
Interest Rate
3.67%
Mortgage Type
Future Advance Clause Open End Mortgage
Create a Home Valuation Report for This Property
The Home Valuation Report is an in-depth analysis detailing your home's value as well as a comparison with similar homes in the area
Home Values in the Area
Average Home Value in this Area
Purchase History
| Date | Buyer | Sale Price | Title Company |
|---|---|---|---|
| Solheim Andy | $650,000 | Regency Title Inc | |
| Asplund Nathan M | $664,965 | Title Co | |
| Titan Homes Inc | -- | None Available |
Source: Public Records
Mortgage History
| Date | Status | Borrower | Loan Amount |
|---|---|---|---|
| Open | Solheim Andy | $520,000 | |
| Previous Owner | Asplund Nathan M | $417,000 | |
| Previous Owner | Titan Homes Inc | $245,000 |
Source: Public Records
Tax History
| Year | Tax Paid | Tax Assessment Tax Assessment Total Assessment is a certain percentage of the fair market value that is determined by local assessors to be the total taxable value of land and additions on the property. | Land | Improvement |
|---|---|---|---|---|
| 2024 | $14,856 | $404,150 | $85,900 | $318,250 |
| 2023 | $15,274 | $380,500 | $85,900 | $294,600 |
| 2022 | $15,584 | $356,600 | $85,900 | $270,700 |
| 2021 | $15,311 | $333,700 | $74,450 | $259,250 |
| 2020 | $15,144 | $329,950 | $74,450 | $255,500 |
| 2019 | $15,347 | $329,050 | $74,450 | $254,600 |
| 2018 | $15,370 | $334,250 | $74,450 | $259,800 |
| 2017 | $13,268 | $259,250 | $74,450 | $184,800 |
| 2016 | $12,464 | $249,100 | $74,450 | $174,650 |
| 2015 | $5,963 | $25,200 | $25,200 | $0 |
| 2014 | $4,050 | $25,200 | $25,200 | $0 |
| 2013 | $3,323 | $500 | $500 | $0 |
Source: Public Records
Map
Nearby Homes
- 3839 Reserve Dr E
- 412 38th Ave E
- 3605 Houkom Dr E
- 3731 Hidden Cir
- 414 Westview Ln E
- 3644 6th St E
- 6511 Osgood Pkwy S
- 4195 Furnberg Place S
- 3512 Hidden Way
- 3463 Loberg Dr
- 4355 66th St S
- 717 35th Ave E
- 3321 6th Way E Unit D
- 3541 Eagle Run Ln
- 3509 Eagle Run Ln
- 6977 65th St S
- 6994 65th St S
- 6982 65th St S
- 7108 65th St S
- 6976 65th St S
- 3726 Houkom Dr E
- 3738 Houkom Dr E
- 3720 Houkom Dr E
- 3744 Houkom Dr E
- 3743 Houkom Dr E
- 3714 Houkom Dr E
- 310 38th Ave E
- 3750 Houkom Dr E
- 3749 Houkom Dr E
- 3809 2nd St E
- 3719 Houkom Dr E
- 3806 3rd St E
- 3708 Houkom Dr E
- 3756 Houkom Dr E
- 3713 Houkom Dr E
- 3825 7 1/2 St E
- 318 38th Ave E
- 3825 2nd St E
- 3817 2nd St E
- 3724 4th St E
Your Personal Tour Guide
Ask me questions while you tour the home.