Estimated Value: $543,000 - $667,000
6
Beds
3
Baths
3,130
Sq Ft
$188/Sq Ft
Est. Value
About This Home
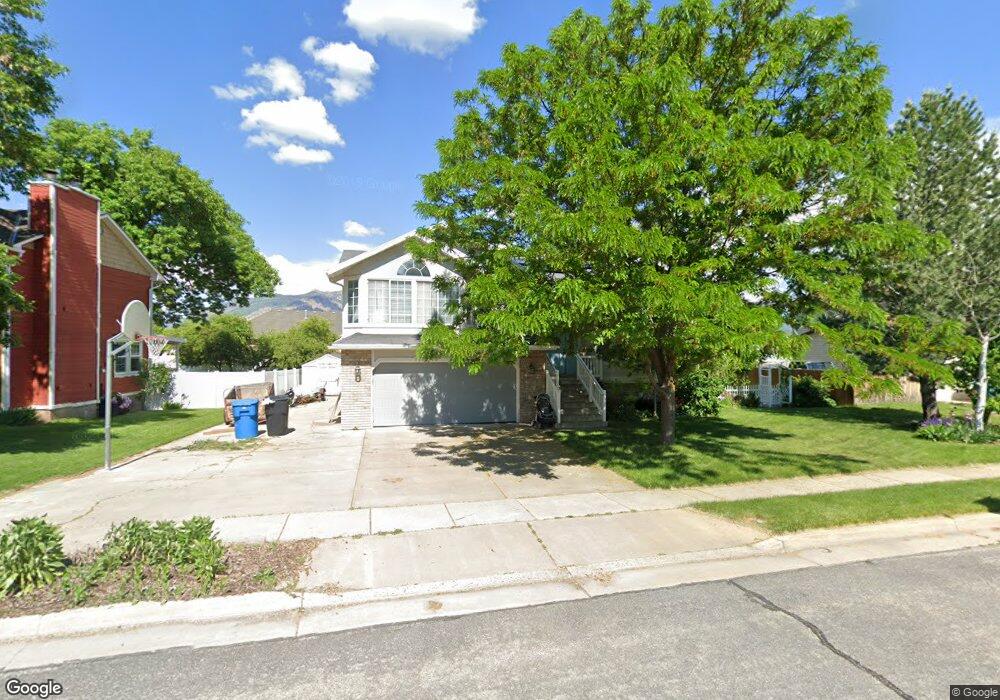
This home is located at 3732 S 650 W, Ogden, UT 84405 and is currently estimated at $587,295, approximately $187 per square foot. 3732 S 650 W is a home located in Weber County with nearby schools including Riverdale School, T.H. Bell Junior High School, and Bonneville High School.
Ownership History
Date
Name
Owned For
Owner Type
Purchase Details
Closed on
Jan 6, 2011
Sold by
Federal Home Loan Mortgage Corporation
Bought by
Packard James and Packard Tamara
Current Estimated Value
Home Financials for this Owner
Home Financials are based on the most recent Mortgage that was taken out on this home.
Original Mortgage
$185,250
Outstanding Balance
$126,539
Interest Rate
4.82%
Mortgage Type
New Conventional
Estimated Equity
$460,756
Purchase Details
Closed on
Sep 27, 2010
Sold by
Solis Marta A
Bought by
Aurora Loan Services Llc
Purchase Details
Closed on
Aug 31, 2010
Sold by
Aurora Loan Services Llc
Bought by
Federal Home Loan Mortgage Corp
Purchase Details
Closed on
Jun 18, 2004
Sold by
Oliver Richard D and Oliver Lori Lin
Bought by
Oliver Richard D and Oliver Lori Lin
Home Financials for this Owner
Home Financials are based on the most recent Mortgage that was taken out on this home.
Original Mortgage
$150,250
Interest Rate
6.09%
Mortgage Type
New Conventional
Create a Home Valuation Report for This Property
The Home Valuation Report is an in-depth analysis detailing your home's value as well as a comparison with similar homes in the area
Home Values in the Area
Average Home Value in this Area
Purchase History
| Date | Buyer | Sale Price | Title Company |
|---|---|---|---|
| Packard James | -- | First American Union Heights | |
| Aurora Loan Services Llc | $218,900 | Security Title Insurance Age | |
| Federal Home Loan Mortgage Corp | -- | Accommodation | |
| Oliver Richard D | -- | Heritage West |
Source: Public Records
Mortgage History
| Date | Status | Borrower | Loan Amount |
|---|---|---|---|
| Open | Packard James | $185,250 | |
| Previous Owner | Oliver Richard D | $150,250 |
Source: Public Records
Tax History
| Year | Tax Paid | Tax Assessment Tax Assessment Total Assessment is a certain percentage of the fair market value that is determined by local assessors to be the total taxable value of land and additions on the property. | Land | Improvement |
|---|---|---|---|---|
| 2025 | $3,015 | $533,322 | $168,908 | $364,414 |
| 2024 | $2,880 | $286,549 | $92,899 | $193,650 |
| 2023 | $2,724 | $268,950 | $92,875 | $176,075 |
| 2022 | $3,021 | $304,150 | $92,875 | $211,275 |
| 2021 | $2,401 | $442,000 | $118,536 | $323,464 |
| 2020 | $2,201 | $374,000 | $71,470 | $302,530 |
| 2019 | $2,163 | $348,000 | $66,501 | $281,499 |
| 2018 | $2,067 | $318,000 | $66,501 | $251,499 |
| 2017 | $1,866 | $274,000 | $61,440 | $212,560 |
| 2016 | $1,763 | $140,792 | $27,651 | $113,141 |
| 2015 | $1,706 | $133,210 | $26,019 | $107,191 |
| 2014 | $1,726 | $133,210 | $26,019 | $107,191 |
Source: Public Records
Map
Nearby Homes
- 635 W 3600 S
- 620 W 3600 S
- 592 W 3550 S
- 3940 Lamplighter Way Unit 40
- 621 Coachman Way
- 644 W Lamplighter Way
- 619 W 4050 S
- 658 W 4150 S
- 748 W 4075 S
- 4196 S 800 W
- 902 W 4200 S
- 1075 W 4175 S
- 4375 Weber River Dr Unit 44
- 4418 S 850 W Unit 14
- 154 E Harris St
- 225 Chimes View Cir
- 215 40th St
- 1198 W 4400 S Unit V
- 2985 Pennsylvania Ave
- 241 E Burch Creek Place
Your Personal Tour Guide
Ask me questions while you tour the home.